Labour force experience
The Labour Force Experience Survey examines labour force activity over a 12-month period. It is a biennial survey of persons in Australia aged 15-69 years. The survey provides information about how many weeks each person spent working, looking for work or not in the labour force, and some additional variables about persons involved in these activities. Information from the latest survey relates to the year ending February 2001.
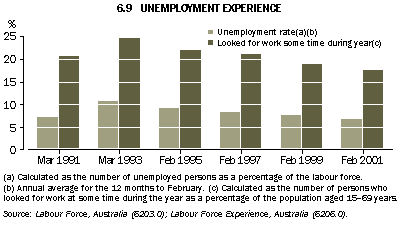
Data from the Labour Force Experience Survey provide additional insights into labour market activity that are not available from data sources measuring labour market activity at a particular point in time. For example, during the 12 months to February 2001, about 59% of persons aged 15-69 were employed at any given point in time. Quite a different picture of the labour market is obtained by examining the labour force experience of persons aged 15-69 years over the same 12-month period. Over the year ended February 2001, about 74% of people worked at some time during the year. Similarly, examining unemployment data for the 12 months to February 2001, the unemployment rate at any given point in time during the year was around 6.8%; however, 17.5% of persons aged 15-69 were looking for work at some time during the year.
The contrast between point in time data (the currently economically active population) and labour force experience data (i.e. the usually active population) is illustrated in graph 6.9. The graph compares unemployment data from the monthly Labour Force Survey with the proportion of people who experienced unemployment at some time during the year. Data are compared over six 12-month periods during the past decade (i.e. those periods for which Labour Force Experience Survey data are available). The proportion of people who looked for work at some time in the previous 12 months was highest in March 1993, corresponding with a high unemployment rate. The number of people searching for work has declined steadily since March 1993. While the longitudinal data provide greater insight into labour market activity, they do not change the overall picture of the state of the labour market.
6.10 LABOUR FORCE EXPERIENCE - Year ending February 2001
|
 | | | Units | Males | Females | Persons |
|
| No change in labour force status during the year | % | 73.3 | 71.2 | 72.3 |
| Not in the labour force at any time during the year | % | 15.1 | 28.9 | 22.0 |
| In the labour force for the whole year | | | | |
| | Worked whole year | % | 56.5 | 41.3 | 48.9 |
| | Looked for work all year | % | 1.7 | 1.1 | 1.4 |
| Change in labour force status during the year | % | 26.7 | 28.8 | 27.7 |
| Worked part of the year(a) | % | 24.5 | 25.2 | 24.8 |
| | Worked 1 to under 26 weeks | % | 6.4 | 7.5 | 6.9 |
| | Worked 26 to under 39 weeks | % | 4.4 | 4.7 | 4.6 |
| | Worked 39 to under 52 weeks | % | 13.8 | 13.0 | 13.4 |
| Other(b) | % | 2.2 | 3.6 | 2.9 |
| Total | % | 100.0 | 100.0 | 100.0 |
| Number | '000 | 6,722.6 | 6,691.3 | 13,413.9 |
|
(a) Labour force status during rest of the year not specified.
(b) Looked for work for part of the year, not in the labour force the rest of the year. |
Source: Labour Force Experience, Australia, February 2001, (6206.0). |
Altogether, about 1.7 million Australians looked for work at some time during the year ended February 2001. Table 6.11 shows the time they spent looking for work and the number of different periods during which they looked for a job. Of those people who looked for work during the year, 53.3% spent less than three months searching for a job. However, 10.9% of job searchers spent the entire year looking for work without finding a job. In terms of the number of spells looking for work, 72.2% of job searchers had only one spell looking for work, but 10.6% of those who looked for work had four or more periods during which they looked for a job.
6.11 PERSONS WHO LOOKED FOR WORK AT SOME TIME DURING THE YEAR - Year ending February 2001
|
| | '000 | % |
|
| Time spent looking for work | | |
| 1 to under 4 weeks | 318.6 | 18.4 |
| 4 to under 13 weeks | 603.0 | 34.8 |
| 13 to under 26 weeks | 267.5 | 15.5 |
| 26 to under 39 weeks | 212.2 | 12.3 |
| 39 to under 52 weeks | 140.8 | 8.1 |
| 52 weeks | 188.5 | 10.9 |
| Number of spells looking for work | | |
| One | 1,249.8 | 72.2 |
| Two | 194.4 | 11.2 |
| Three | 102.8 | 5.9 |
| Four or more | 183.6 | 10.6 |
| Total | 1,730.6 | 100.0 |
|
| Source: Labour Force Experience, Australia, February 2001 (6206.0). |
 Print Page