|
|
 POPULATION POPULATION
NORTHERN TERRITORY POPULATION GROWTH
The estimated resident population of the NT at 30 June 2009 was 225,900 people, up 2.5% (5,400 people) from 30 June 2008. During the five years to 30 June 2009 the NT had the third fastest growing population of all the states and territories after Queensland and Western Australia, with an average annual growth rate of 2.3%.
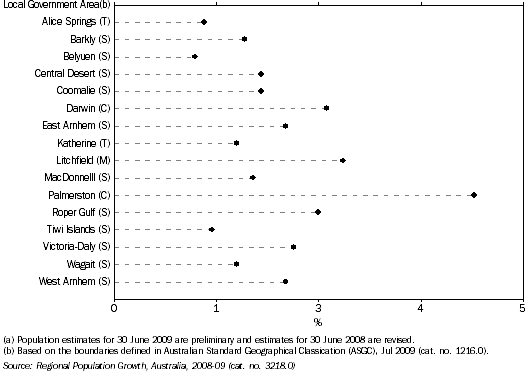
During 2008–09 Darwin SD grew faster than Northern Territory - Bal SD with a growth rate of 3.1% compared to 1.7%. Three of the five fastest growing LGAs during 2008–09 were within Darwin SD (Palmerston (C) up 4.4%, Litchfield (M) up 2.8% and Darwin (C) up 2.6%), the remaining two were Roper Gulf (S) (up 2.5%), and Victoria-Daly (S) (up 2.2%).
POPULATION CHANGE BETWEEN 30 JUNE 2008 AND 30 JUNE 2009(a)

| POPULATION ESTIMATES |  |  |
 |  |  |
 |  |  |
 |  |  |
 |  |  |
| Description of data available |  | Link to data |
|
| Estimated resident population, by region, 30 June 2001 to 30 June 2009 (ASGC 2009) |  | Regional Population Growth, Australia, 2008–09 (cat. no. 3218.0) |
 |  |  |
| Estimated resident population, by age, sex and region, 30 June 2004 and 30 June 2009 (ASGC 2009) |  | Population by Age and Sex, Regions of Australia, 2009 (cat. no. 3235.0) |
 |  |  |
| Experimental estimates of the Indigenous population by age, sex and state/territory, 1986 to 2006 |  | Experimental Estimates and Projections, Aboriginal and Torres Strait Islander Australians, 1991 to 2021 (cat. no. 3238.0) |
 |  |  |
| Experimental projections of the Indigenous population, by state/territory, 2006 to 2021 |  | Experimental Estimates and Projections, Aboriginal and Torres Strait Islander Australians, 1991 to 2021 (cat. no. 3238.0) |
|
 |  |  |
 |  |  |
 |  |  |
 |  |  |
 |  |  |
 |  |  |
 |  |  |
| BIRTHS AND DEATHS |  |  |
 |  |  |
 |  |  |
 |  |  |
 |  |  |
| Description of data available |  | Link to data |
|
| Births, Summary, States and territories, 1999 to 2009 (ASGC 2009) |  | Births, Australia, 2009 (cat. no. 3301.0) |
 |  |  |
| Deaths, Summary, States and territories, 1999 to 2009 (ASGC 2009) |  | Deaths, Australia, 2009 (cat. no. 3302.0) |
 |  |  |
| Births, by Statistical Local Area, NT, 2004 to 2009 |  | Births, Australia, 2009 (cat. no. 3301.0) – refer to table 3 |
 |  |  |
| Deaths, by Statistical Local Area, NT, 2004 to 2009 |  | Deaths, Australia, 2009 (cat. no. 3302.0) – refer to table 5 |
 |  |  |
| Indigenous births and deaths, by Statistical Subdivision, NT, 2008 (ASGC 2008) |  | Indigenous Births and Deaths by Statistical Subdivision, NT, 2008 |
 |  |  |
| Indigenous births, by state/territory, 2009 |  | Births, Australia, 2009 (cat. no. 3301.0) |
 |  |  |
| Deaths, Indigenous Status, by state/territory, 1991 to 2009 |  | Deaths, Australia, 2009 (cat. no. 3302.0) |
 |  |  |
| Median age at death, Indigenous status, selected states and territories, 1991 to 2009 |  | Deaths, Australia, 2009 (cat. no. 3302.0) |
 |  |  |
| Infant mortality rates, Indigenous status, selected states and territories, 1991 to 2009 |  | Deaths, Australia, 2009 (cat. no. 3302.0) |
|
 |  |  |
 |  |  |
 |  |  |
 |  |  |
 |  |  |
 |  |  |
 |  |  |
| POPULATION CHARACTERISTICS |  |  |
 |  |  |
 |  |  |
 |  |  |
 |  |  |
| Description of data available |  | Link to data |
|
| Country of birth, by Statistical Subdivision, NT, 2006 |  | Regional Statistics, Northern Territory, 2008 Reissue (cat. no. 1362.7) – refer to Population data cube |
 |  |  |
| Language spoken at home, by Statistical Subdivision, NT, 2006 |  | Regional Statistics, Northern Territory, 2008 Reissue (cat. no. 1362.7) – refer to Population data cube |
 |  |  |
| Household composition, by Statistical Subdivision, NT, 2006 |  | Regional Statistics, Northern Territory, 2008 Reissue (cat. no. 1362.7) – refer to Population data cube |
 |  |  |
| Family type, by Statistical Subdivision, NT, 2006 |  | Regional Statistics, Northern Territory, 2008 Reissue (cat. no. 1362.7) – refer to Population data cube |
 |  |  |
| Number of motor vehicles, by occupied private dwellings, NT, 2006 |  | 2006 Census Tables (cat. no. 2068.0) |
|
|
|
 Print Page
 Print All