 TRADE
TRADE
BALANCE OF TRADE
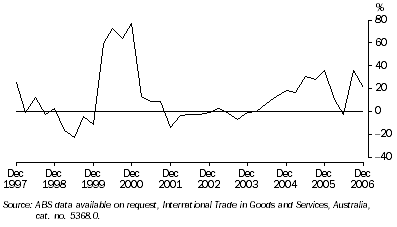
Western Australia's trade surplus rose by 21.4% ($1,748 million) to $9,919 million through the year to December quarter 2006, following a strong rise in the previous period of 35.7% ($2,613 million) through the year to September quarter 2006.
VALUE OF WESTERN AUSTRALIA'S TRADE SURPLUS, Change from same quarter previous year

Growth in Western Australia's trade surplus through the year to December quarter 2006 was mainly driven by larger trade surpluses with China (up $920 million) and India (up $752 million), as well as with Singapore (up $301 million) and Finland (up $293 million). A much lower trade surplus was, however, recorded with the United Kingdom (down $418 million), while the state's trade deficit worsened with the United States (up $155 million) and Germany (up $144 million).
EXPORTS
The value of exports from Western Australia rose by 26.4% ($3,242 million) to $15,500 million through the year to December quarter 2006. The major commodities driving the growth in exports were non-monetary gold (up $846 million or 54.3%), combined confidential items (up $676 million or 34.0%), iron ore and concentrates (up $630 million or 18.7%), crude petroleum oils (up $336 million or 23.7%), nickel (up $209 million or 140.6%) and nickel ores and concentrates (up $140 million or 55.4%). The major detractors from exports growth over the period were wheat (down $29 million or 6.6%) and pigments, paints, varnishes and related materials (down $20 million or 17.4%).
IMPORTS
The value of imports into Western Australia increased by 36.5% ($1,494 million) to $5,581 million through the year to December 2006. The major commodities driving the growth in imports were non-monetary gold (up $610 million or 100.2%), civil engineering and contractors' plant and equipment (up $92 million or 76.4%), passenger motor vehicles (up $82 million or 26.1%) and motor vehicles for transporting goods and specialised vehicles (up $65 million or 40.5%). The major commodities recording declines in imports over the period were fertilizers (down $59 million or 94.2%) and crude petroleum oils (down $56 million or 11.5%).
 Print Page
 Print All