6105.0 - Australian Labour Market Statistics, July 2013
ARCHIVED ISSUE Released at 11:30 AM (CANBERRA TIME) 10/07/2013
Page tools:
 Print Page Print Page
 Print All Print All
| ||
|
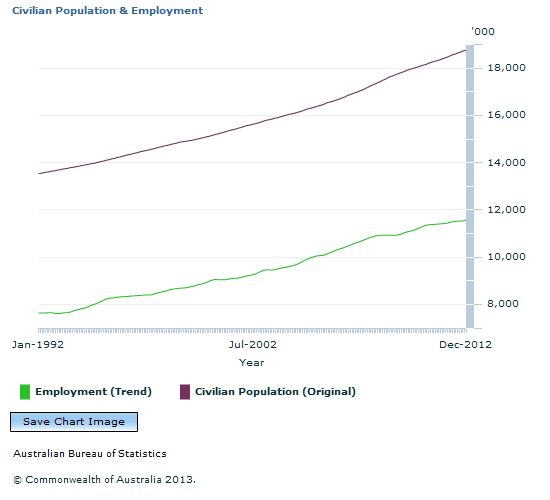
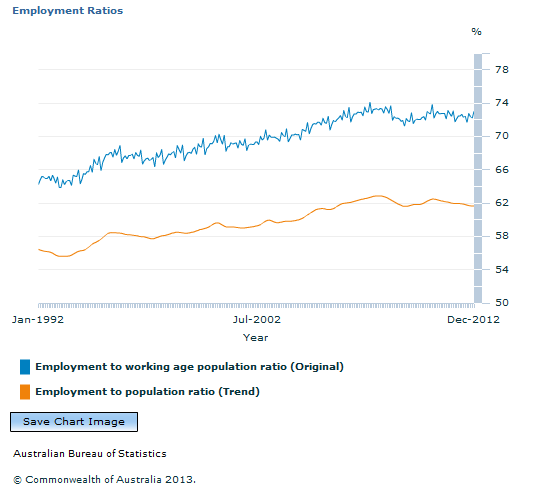
EMPLOYMENT MEASURES Introduction Estimates of employment are some of the key statistics produced from the ABS's monthly Labour Force Survey (LFS). While the number of people who are employed is a widely used measure from the LFS, other measures of employment, such as those that relate employment to various populations, can be just as useful - if not more useful - in understanding the characteristics of, and changes in, Australia's labour market. This article discusses some of the key employment measures that can be used to help understand the labour market. Level estimates versus rates Employment levels show the number of people who worked for at least one hour or more for pay or profit in the survey's reference week, or had a job but were away from work. Despite being the most commonly used measure of employment, employment levels do not reveal any striking dynamics in the labour market when used in isolation, as the trend generally increases at a steady rate over time. This is because employment level estimates are usually related to population growth. It can be seen in the following graph that the number of people employed generally increases over time at a similar rate to the population. From 2008, however, employment growth has increased at a slower rate than previous years, while population growth has increased at a faster rate.  Source(s): Labour Force, Australia (cat. no. 6202.0); Labour Force, Australia, Detailed - Electronic Delivery (cat. no. 6291.0.55.001) There are a number of different employment rates that can be produced through using different denominators and these are discussed below. The employment to population ratio The employment to population ratio shows the number of people aged 15 years and over that are employed as a percentage of the civilian population aged 15 years and over. This measure removes the influence of population growth when interpreting changes in employment estimates. In doing so, it enables comparisons of employment rates at different periods of time, as well as between countries. Although males have a higher employment to population ratio than females, the gap between males and females has decreased over time, dropping from 19 percentage points in 1992 to 12 percentage points in 2012. .gif) Source(s): Labour Force, Australia (cat. no. 6202.0) The employment to working age population ratio shows the number of people that are employed (aged 15 to 64 years) as a percentage of the working age population (civilian population aged 15 to 64 years). This measure is less impacted over time by changing demographic structures than the employment to population ratio, as it excludes the older age group (those aged 65 years and over) of which the majority (88%) are not in the labour force, including those retired or permanently not intending to work. In 2012 employed people aged 65 years and over accounted for only 3% of all employed people and 12% of the civilian population aged 65 years and over. In the graph below it can be seen that the employment to working age population ratio is roughly 10 percentage points higher than the employment to population ratio, however they have both changed at similar rates over the past 20 years. Because there are some sensitivities when defining 'working age' it is also possible to create similar measures of employment for 'prime age' workers, typically defined as those aged 25 to 54 years, the age groups with higher labour force participation. In 2012, people aged 25 to 54 years had a labour force participation rate of 83%, relatively higher than people aged 15 to 24 years (68%) and 55 years and over (35%). The employment to working age population ratio is useful to use when comparing different population groups, e.g. Aboriginal and Torres Strait Islander population with the non-Indigenous population. However, where there are significant differences in age structures between population groups, age-standardised estimates can be created to account for the differences in age structures. Age standardisation is a statistical method that adjusts crude rates to account for age differences between study populations. Age standardisation enables better comparisons between different populations, however, creating age standardised estimates can be time consuming and difficult to explain and interpret, while the employment to working age population ratio is a simpler way to compare different groups.  Source(s): Labour Force, Australia (cat. no. 6202.0); Labour Force, Australia, Detailed - Electronic Delivery (cat. no. 6291.0.55.001) The employment to labour force ratio, also known as the employment rate, is the inverse of the unemployment rate. The employment to labour force ratio shows the number of people that are employed as a percentage of the labour force. This ratio is useful when looking at employment as a proportion of all currently available labour supply, but is a relatively narrow measure when compared with the employment to population ratio. The above graph shows that the majority of the labour force is employed. The employment to labour force ratio reached a high of 95.8% in 2008 before dropping to 94.4% in 2009 during the most recent economic downturn. Employment as a proportion of all people who are in work or want to work Examining employment in relation to all people who are in work or want to work can be useful to understand how well people's aspirations to work are being met in the economy. This measure is similar to the employment to labour force ratio, however the denominator is expanded to include people who are not in the labour force who report that they want to work, i.e. that they have a desire or aspiration for work. Data are sourced from the Persons Not in the Labour Force survey (cat. no. 6220.0), which is currently conducted in September each year. The employment to all people who are in work or want to work ratio is roughly 10 percentage points lower than the employment to labour force ratio. This is due to more people being included in the denominator while the number of employed (in the numerator) stays the same. The employment to all people who are in work or want to work ratio has stood at over 85% since 2005. .gif) Source(s): Persons Not in the Labour Force (cat. no. 6220.0); Labour Force, Australia, Detailed - Electronic Delivery (cat. no. 6291.0.55.001) Document Selection These documents will be presented in a new window.
|
|
