This is not the latest release View the latest release

Australian Labour Account

Labour Statistics: Concepts, Sources and Methods
Reference period
2021
Released
15/02/2022

The Australian Labour Account provides a conceptual framework for integrating data from a number of sources including household survey, business survey and administrative data to produce a coherent and internally consistent set of aggregate estimates of key labour market variables, which more effectively enable the description and analysis of the state and dynamics of the Australian labour market. These core variables can help users make sense of seemingly inconsistent labour related data, which are often based on different reference periods, populations, concepts, definitions and methodologies.

The Australian Labour Account is macro-economic in scope, building on the International Labour Organisation fundamentals and expanding them to ensure consistency with the Australian System of National Accounts. It aims to extend the analytical capacity of national accounts data by providing a labour-specific lens. The Australian Labour Account framework has been designed to conceptually align with the System of National Accounts production boundary (see Institutional Units and the Economically Active Population). This ensures direct compatibility with National Accounts and productivity estimates, as well as providing a mechanism for bringing together conceptually related aggregate data from business, household and administrative sources.

The Labour Account provides a time series of estimates of the number of employed persons, the number of jobs, hours worked and the income earned for each industry in one coherent framework. Historically, published estimates of employed persons in each industry have only been available for industry of main job. The expanded scope and additional data sources used in the Labour Account include data for multiple job holders by their industry of second, third and fourth job. The Australian Labour Account is published on a quarterly basis in Labour Account Australia.

The Australian Labour Account framework incorporates four quadrants: Jobs, Persons, Labour Volume and Labour Payments.

Australian Labour Account quadrants

Australian Labour Account quadrants
The four quadrants of Labour Account made up Jobs; Persons; Labour (volume) and Payment. The jobs quadrant provides data on numbers of filled jobs, vacant jobs and total number of jobs in the economy. The persons quadrant provides data on numbers of employed persons, together with data on numbers of unemployed and underemployed persons. The labour volume quadrant provides data on the relationship between hours of labour supplied by individuals, and hours of labour used by businesses. Lastly, the labour payments quadrant provides data on the relationship between total labour costs by businesses and total labour income by workers.

International context

There are currently no international standards regarding the production of a labour account, however a four step process has been documented by the ILO and was followed (to varying degrees) by the National Statistical Organisations in Denmark, the Netherlands and Switzerland in compiling their own labour accounts. The ILO process has been used as a guide in compiling the Australian Labour Account. For further information on the four step process, refer to Labour Accounts: A Step Forward to a Coherent and Timely Description of the Labour Market.

The ILO describes two approaches to compiling a labour account: a cross-sectional approach involving confrontation and reconciliation of key labour market measures, and a longitudinal approach which incorporates changes to population and labour force via births, deaths, and net migration, and includes measures such as duration of employment. The Australian Labour Account focuses on the cross-sectional approach (since this is the approach that supports data confrontation and reconciliation), and also provides a time-series dimension.

The ILO lists six central elements in labour statistics:

  • employed persons and jobs;
  • unemployed and underemployed persons;
  • job vacancies;
  • hours of work and full-time equivalents;
  • income from employment and labour costs; and
  • organisation of the labour market (i.e. statistics on collective labour agreements, industrial disputes and trade-union memberships).

No country has yet compiled a labour account that measures all of these elements. The Australian Labour Account covers most elements listed in the ILO approach, with the exception of data on full-time equivalents and statistics on labour market organisation. The Australian Labour Account also includes measures of underutilised labour (an estimate of the hours of work sought by the unemployed, plus additional hours preferred by the underemployed).

The Australian Labour Account, in particular the quarterly information disaggregated by industry division, provides an opportunity to significantly improve the quality of aggregates such as the number of jobs occupied and total number of persons employed within each industry, measures of hours worked, and changes in labour productivity.

Uses of the Labour Account

The Australian Labour Account is an enhancement to the broader set of Australia’s National Accounts. It aims to provide a set of labour related statistics on employed persons, filled jobs, hours and payments that is consistent with the concepts, definitions and scope of the Australian National Accounts.

Australian Labour Account data are likely to be of most value to people engaged in the use of labour statistics in macro-economic analysis, forecasting and in policy related research. They should also assist economic journalists and public commentators in informing public understanding of labour statistics.

The Australian Labour Account should be used for industry analysis of labour growth and performance in terms of people, jobs, hours, labour costs and income. For example, Labour Force Survey data for employed persons by industry has historically only been available for industry of main job. The expanded scope and additional data sources of the Australian Labour Account includes data for the total number of all secondary jobs (including second, third and fourth job etc.), allocated to industry of main and secondary job. This allows for an industry perspective of the number of people employed in each industry in a time series. These data can be used by researchers and policy makers to better model how the number of people employed could be impacted by shocks to industry or changes to policy.

The Australian Labour Account is a complement to the existing suite of labour statistics. Users should continue to use the Labour Force, Australia for headline employment, unemployment and persons not in the labour force estimates, as this is the data suite that is internationally comparable and aligned with International Labour Organisation (ILO) conventions.

Macro-economic analysis

The Australian Labour Account draws on the macro-economic framework and statistical techniques used in the Australian National Accounts to help address the inconsistencies, scope gaps, frequency and timeliness shortcomings of labour data drawn from a variety of business and household surveys and other administrative sources.

The Australian Labour Account tables are designed for use in macro-economic analysis. They provide annual and quarterly data on a similar timetable and at a similar level of industry detail as the national accounts.

An important use the Australian Labour Account is expected to be in the analysis of productivity, where the Australian Labour Account will provide data on hours worked at an industry level that is more coherent with industry output than data currently available from the household Labour Force Survey.

The Australian Labour Account should assist users in understanding the employment implications, at a macro-economic scale, of developments such as globalisation, new technologies, growth of services and the changing pattern of global demand for resources.

The Australian Labour Account will also help users understand the economic contribution of groups who fall outside the scope of official Labour Force Survey statistics, particularly the role of short-term working visa holders.

Micro-economic analysis

The Australian Labour Account tables do not incorporate detailed data on employment by age, gender, income, earnings, employment arrangements, union membership, occupation, educational qualifications or region.

If users require detailed dynamics essential for analysis of individual or household characteristics, they should continue to rely on the Census, household and business surveys, and on exploiting the potential of tax and other administrative transaction records. The Australian Labour Account nevertheless provides a macro-economic context within which to understand and interpret micro-economic labour data.

International comparisons

To enable the international comparison of labour statistics, especially data on employment and un-employment, Australia (along with most countries) follows guidelines and standards established by the ILO. Australia’s official labour force data, derived from the household Labour Force Survey, remains the source of internationally comparable statistics on the labour force, employment and unemployment.

Due to practical difficulties in consistently measuring work undertaken by certain population groups, particularly children, transient workers and defence force personnel, ILO standards exclude these groups, despite the fact their labour activities contribute to national production. The Australian Labour Account shows that persons excluded from the scope of official Labour Force Survey statistics account for about 5% of all persons employed in production in Australia. The Australian Labour Account, based on 2008 System of National Accounts (2008 SNA) standards, should assist in making more reliable and transparent comparison of productivity statistics and other data that relate labour inputs to production, earnings and expenditure.

Limitations to be aware of in the use of the Labour Account are described below.

Conceptual limitations

The purpose of the Australian Labour Account is to support macro-economic analysis requiring data on the participation of the population in paid employment and related economic production. In addition, the Australian Labour Account is designed to be consistent in concept and scope with the Australian System of National Accounts (ASNA). For this reason, work which falls outside the ASNA definition of economic activity such as cleaning, cooking and child care produced and consumed within households, and voluntary work undertaken outside institutional settings such as coaching children’s sports teams, are excluded from the scope of the Australian Labour Account. Estimates of numbers of persons engaged, and hours spent, in unpaid work are available from other sources, e.g. How Australians Use Their Time, 2006.

Content limitations

The macro-economic emphasis is again reflected in the level of disaggregation of Australian Labour Account data. The focus is on the national economy, with data disaggregated by industry at the Australian and New Zealand Standard Industrial Classification (ANZSIC) division and subdivision levels. Data are available both quarterly and annually, with quarterly data published in close succession to the Australian National Accounts. The development of a state level component, in line with the state component of the Australian National Accounts, would be a potential further extension of the Australian Labour Account.

Scope limitations

Some types of activity conceptually falling within the scope of the Australian Labour Account may be excluded from, or not well measured in, the available data sources. These are summarised below.

Scope limitations impacting both household and business estimates include:

  • jobs associated with illegal or hidden activities (the non-observed economy) are likely to be under-reported in both business and household surveys;
  • positions that are voluntary, with no remuneration at all, not even in kind, but working within a recognised institutional unit, are outside the scope of both business and household collections;
  • non-salaried directors are not included in business or household sources;
  • child workers under the age of five are outside the scope of business collections (those who are self-employed or contributing family workers) and household collections (all employed children under five); and
  • there is no good source of data on jobs that are filled by two or more people under a job sharing arrangement. On both the business and the household sides, a position that is filled by a job sharing arrangement would be counted as multiple filled jobs, not a single job held by multiple employed persons.

Scope limitations impacting household side estimates include:

  • data on hours worked are calculated for a particular reference week each month, and are assumed to be representative of weeks for which data are not collected;
  • industry estimates for the unemployed population are based on industry of last job worked (within the past two years) from the Labour Force Survey, and do not necessarily equate to the industries in which the unemployed are currently seeking work, nor do they include those unemployed persons who have never held a job previously;
  • no adjustments have been made to align the Labour Force Survey unemployed persons or hours sought with the 2008 SNA residency and production boundaries, as there is no reliable information to derive estimates of additional hours of work sought by short term working visa holders. It is also assumed that defence force personnel and child workers are fully employed. The Labour Account should not be used to derive proportional measures such as an unemployment rate or participation rate, as the numerator and denominator are not strictly comparable;
  • illegal non-resident job holders: the estimated number of short term (less than 12 months) visitors to Australia who work for Australian resident enterprises is based on numbers of working visa holders. No estimate is made for those working without an appropriate visa; and
  • Australian residents living in Australia employed by overseas resident enterprises: an estimate of the number of jobs filled by these people has been deducted from household side estimates, based on data supplied by the Department of Home Affairs. This estimate only represents persons working in diplomatic or consular related jobs.

Scope limitations impacting business side estimates include:

  • domestic staff employed by private households are outside the scope of business surveys used in compiling business sources estimates of filled jobs, but would be in scope of the Labour Force Survey;
  • jobs held by self-employed persons operating their business without a registered ABN fall outside the scope of business surveys, but would be in scope of household surveys;
  • employees on workers’ compensation who are not paid through the payroll are not included in business side sources;
  • estimates for employment subsidies in the Labour Payments quadrant are based on Commonwealth data sourced from the Department of Finance. No adjustment has been made for employment subsidies paid under State or Local government schemes. Employment subsidies can be difficult to classify, particularly state or local government schemes for which information is often limited;
  • no adjustments have been made to labour payments for unpaid employed persons (both adult and child workers) working on a farm or in a family business (contributing family workers). It is likely that these employed persons are paid in-kind, but this is impossible to estimate with any degree of confidence;
  • no adjustment has been made for payments made to child workers under self-employment arrangements in the Labour Payments quadrant. It is possible that self-employed child workers are not being captured in labour payment estimates, as they are likely to not have an ABN and therefore be out of scope of ABS business surveys. One of the most common occupations from the 2006 Child Employment Survey was Leaflet or Newspaper Deliverer. It is likely that an employed child delivering leaflets would be treated as an independent contractor by their employer, and not an employee. In this situation, if the employed child does not have an ABN, they are unable to be selected for ABS business surveys.
  • job vacancies data does not include vacancies available in the non-observed economy (jobs associated with illegal or hidden activities), private households employing staff, foreign embassies and consulates, and Australian permanent defence forces.
  • the National Skills Commission Internet Vacancy Index, used to supplement ABS Job Vacancy Survey data for the Agriculture, Forestry and Fishing Division, only includes job advertisements listed on the internet. Job advertisements listed only in newspapers, on notice boards and other mediums (other than the internet) are not included;
  • there is no known data source relating to hours worked but not paid, or hours paid but not worked; and
  • the survey of Employee Earnings and Hours, which is used as a source for calculating hours paid, excludes employees in certain industries and in certain employment categories (e.g. employees on leave without pay, on strike, or casuals not rostered to work during the survey reference period, managerial employees where there is no link between pay and hours worked, and employees on workers’ compensation who are not paid through the payroll).

Other limitations

Timeliness:

  • Annual industry statistics compiled from the annual EAS are not available at the time required for compiling the latest annual Australian Labour Account estimates, requiring the extrapolation of Labour Account filled jobs (and related) data for up to seven quarters.
  • There is a time lag between the current reference period and the release of data in Government Finance Statistics, Australia. Therefore, data for employment subsidies in the Australian Labour Account are extrapolated forwarded based on the movement of previous data.

Data availability:

  • Data on numbers of child workers has not been collected since 2006. In modelling current estimates of numbers of child workers, assumptions are made about the proportion of children working, the industries in which they work and their propensity to hold secondary jobs.
  • Data are not available for earlier parts of some series of the Australian Labour Account, and missing data have been estimated through applying movements or proportional distribution from a conceptually related series to observed Australian Labour Account data. Data estimated in this way should not be considered to be as statistically robust as data based on observed and comparable survey estimates.

Accuracy

  • As noted in the discussion of Balanced Tables, there are several sources of statistical error in source data which are reflected in internal discrepancies within the Australian Labour Account, most notably between household and business side estimates of numbers of filled jobs.

Methodological limitations

  • Methods used in compiling Australian Labour Account statistics are constrained by the robustness of their assumptions. Assumptions made in the Australian Labour Account include:

Jobs quadrant:

  • quarterly estimates of private sector business sources filled jobs assume that movement in numbers of jobs reported are indicative of changes in benchmarked employment numbers reported in Australian Industry;
  • that short term student visa holders have similar levels of employment to other resident students aged 15-24 years;
  • that short term visa holders other than students and sponsored visa holders have similar levels of employment to the broader resident population;
  • that permanent defence force personnel and employed children under 15 years do not hold secondary jobs; and
  • that average proportions of multiple job holders with second, third and fourth jobs apply to time periods prior to 2014. While data collected prior to 2014 can identify whether an employed person is a multiple job holder, numbers of secondary jobs were not collected from the LFS prior to 2014.

Labour Volume quadrant:

  • that derived weekly averages sourced from the Survey of Employee Earnings and Hours (used in computing hours paid for) are equally applicable to employees who are not covered by the survey, including:
  • employees on leave without pay, on strike, or casuals not rostered to work during the survey reference period;
  • persons engaged in the Agriculture, Forestry and Fishing industry;
  • employees on workers’ compensation who are not paid through the payroll; and
  • members of the Australian permanent defence forces.


Labour Account framework

The Australian Labour Account framework has been designed to conceptually align with the accounting conventions of the United Nations System of National Accounts (2008 SNA), as applied in the Australian System of National Accounts (ASNA). In particular, the Australian Labour Account aligns with production and residency boundaries of the ASNA. This ensures direct compatibility with national accounts and productivity estimates, as well as providing a mechanism for bringing together conceptually related aggregate data from business, household and administrative sources. The scope of the Australian Labour Account is consistent with that of the national economy, as defined in the Australian System of National Accounts (ASNA), which follows the international standard set out in the United Nations System of National Accounts.

The Labour Account consists of four quadrants: Jobs; Persons; Labour Volume and Labour Payments.

  • The Jobs Quadrant provides data on numbers of filled jobs derived separately from business and household sources, plus data on vacant jobs to provide a total number of jobs in the economy.
  • The Persons Quadrant includes data on numbers of employed persons, together with data on numbers of unemployed and underemployed persons (derived from household sources).
  • The Labour Volume Quadrant provides data on hours paid for (derived from business sources) and hours worked (from household sources), plus data on additional hours of work sought by unemployed and underemployed persons (from household sources).
  • The Labour Payments Quadrant provides data on labour income and employment costs (from business sources).

The Labour Account combines data from the persons, jobs, labour volume and labour payments tables to calculate average hours worked, average remuneration (per person and per job), and average labour cost per hour worked.

The four quadrants are linked by a set of identity relationships, which the aggregate statistics must satisfy. These identities are shown below. The identities used in the Australian Labour Account are consistent with the identities used in other countries. Some relationships are direct, such as employed persons in the total economy is equal to the number of main jobs, while other relationships are considered indirect or derived, such that the relationship is based on an average or ratio measure such as average hours worked per job, or average labour income per employed person.

Identity relationship diagram

Identity relationship diagram
The Labour Account identity relationship diagram displays the four quadrants (jobs, persons, volume and payments) and identifies the relationships between each of these quadrants. These four quadrants are linked by a set of identity relationships which is represented in this identity relationship diagram. Some relationships are direct, such as employed persons in the total economy is equal to the number of main jobs, while other relationships are considered indirect or derived, such as average labour income per employed persons.

Conceptual framework

Labour Account conceptual framework

Labour Account conceptual framework


Labour Account concepts

The supply of labour relates to the quantum of labour services offered by people (i.e. the number of hours actually worked by employed persons, plus the number of additional hours being sought by those who are either unemployed or underemployed). Household surveys are the primary source of data on the supply of labour, supplemented by related administrative data.

Labour demand relates to the quantum of labour services sought by companies and other institutional units engaged in economic activity, within the scope of the 2008 SNA production boundary. It includes the numbers of hours actually paid for in filled jobs, plus the unmet labour demand by employing units measured through vacant jobs. Surveys of businesses, government and not-for-profit institutions and relevant administrative data sets are the main sources of information on labour demand.

Production boundary

Accounts compilation uses some important boundaries to define the scope and treatment of events that occur within the economy. These boundaries are:

  • the production boundary defining the scope of productive economic activity; the asset boundary distinguishing transactions in assets from income and expenditure; and
  • the boundary between current and capital transfers (IMF, 2007, The system of macroeconomic accounts statistics: an overview, Pamphlet series no. 56).

The definition of the production boundary used in the Australian Labour Account determines the scope of activities covered, and the size of the economy measured in the account.

The Australian Labour Account includes all persons employed in economic activity as defined by the 2008 SNA. Economic activity is the production of goods and services falling within the 2008 SNA production boundary by institutional units resident in the Australian Economic Territory. In the 2008 SNA, production is viewed as a physical process in which labour and assets (capital) are used to transform inputs of energy, materials and services into outputs of other goods and services.

In its simplest form, economic activity is the production of goods and services, and in the 2008 SNA is always a result of production (ASNA, 2.8).

Economic activity covers all market production and certain types of non-market production, including the production and processing of primary produce by households for their own consumption (e.g. vegetable gardens, fruit trees or eggs from chickens), the construction of dwellings and structures for own use, the production of fixed assets for own use and the production of dwelling services from owner occupied homes.

Scope – economic activity in terms of 2008 SNA concept of goods and services production

Scope – economic activity in terms of 2008 SNA concept of goods and services production
The diagram shows there are economic activities (i.e. related to the production of goods and services) and non-economic activities. Economic activities are either market production or non-market production. Market production is the production of goods and services normally intended for sale on the market; and production of other goods and services such as government activities. Non-market production is the production of primary products for own consumption; processing of primary commodities for own consumption by the producers of these items; production of fixed assets for own use; and production for own consumption of other commodities by persons who also produce them for the market.

While the 2008 SNA definition of the production of goods and services covers a wide range of activities, many other activities still remain outside its scope. For example, the production of domestic and personal services for consumption within the same household (such as preparing meals and caring for children) is excluded. The production of most domestic and personal services is excluded, as the decision to consume these services within the household is made even before the service is provided, and because of the adverse effects their inclusion would have on the usefulness of the accounts for policy purposes and analysis of inflation and unemployment. The extension of the production boundary to include own account household services would result in virtually the whole adult population being defined as 'economically active', unemployment under the existing International Labour Organisation (ILO) definition would cease to exist, and employment statistics would become meaningless (2008 SNA, 1.42, 6.31; ASNA, 8.3).

One exception is the production of dwelling services from owner occupied housing. This is a pragmatic compromise required to allow comparison of economic activity between countries with significant differences in rates of home ownership. However, no labour input is associated with this activity.

Unpaid work and volunteer services

A distinction can be made between those who have an agreement to provide labour for token remuneration or income in kind, those for whom there is explicitly no remuneration, and those where there is apparently no remuneration but the workers benefit directly from the output to which they contribute. In ILO statistics, all three types of worker are included in the economically active population as employees.

In the 2008 SNA, the remuneration of those working for token amounts or only income in kind is measured by these costs. No imputation for an additional element of remuneration is included. For example, if doctors or teachers work for only food and lodging, the value of this as income in kind is the only remuneration imputed to them. Such instances may arise in religious institutions, or in the wake of natural disasters. If the unit employing these staff is responsible for whatever little remuneration is received, these people are classed as employees and included in the scope of the Australian Labour Account.

If staff are purely voluntary, with no remuneration at all, not even in kind, but are working in a recognised institutional unit (business, government agency, not-for-profit organisation) engaged in economic activity, then these individuals are still regarded as being employed in 2008 SNA terms. As they are not paid, there is no related compensation of employees recorded for them. Individuals providing services to groups of other individuals, such as coaching a children’s sports team, without any associated infrastructure, are not regarded as employed but rather engaging in a leisure pursuit (2008 SNA, 19.37 - 19.39).

Although they fall within scope of the 2008 SNA, the Australian Labour Account does not include estimates of numbers of persons engaged by institutional units on a purely voluntary basis. This is consistent with the current treatment in the ASNA, which unlike the 2008 SNA does not allow for the measurement of voluntary contributions of labour.

If family members contribute to the output of an unincorporated enterprise, the estimate of mixed income is assumed to include an element of remuneration for them, and thus they are all treated as being in the economically active population from a 2008 SNA point of view (2008 SNA, 19.40). The Australian Labour Account includes estimates for contributing family members, consistent with the 2008 SNA.

In scope activities with the ASNA

In scope activities with the ASNA
The diagram describes economic production and non-productive activities. Economic production is the activities in units that produce goods and services included in the general production boundary of the System of National Accounts. These are further categorised according to whether they are within scope of the Australian System of National Accounts (ASNA). Activities within scope of the ASNA are: paid employment; self employment in market enterprises; subsistence work; and reported illegal activities. Activities outside of the scope of the ASNA (but within the general production boundary) are: unreported illegal activities; volunteer work; and unpaid household work. Non-productive activities include participating in: education, training and study; leisure and culture; and self care (eating, sleeping, grooming etc.).

Treatment of illegal activities

The 2008 SNA treats illegal actions that conform to the characteristics of transactions (notably the characteristic that there is mutual agreement between the parties) in the same way as legal actions. Thus, although the production or consumption of certain goods such as narcotics may be illegal, market transactions in such goods should, in principle, be recorded in the national accounts.

As such, the work done by people working illegally on a farm (i.e. visa holders working in breach of visa conditions), working in the construction industry without a permit, selling merchandise without a licence, or working ‘cash-in-hand’ for tax evasion purposes or for fear of being reported to immigration officials, falls within the scope of economic activity.

However, many illegal actions are crimes against persons or property that cannot be construed as transactions. For example, theft is not an action into which two units enter by mutual agreement. Conceptually, theft or violence is an extreme form of externality in which damage is inflicted on a household or another institutional unit deliberately, and not merely accidentally or casually. Thus, thefts of goods from households, for example, are not treated as transactions and estimated values are not recorded for them under household expenditures (2008 SNA 3.97; ASNA 3.22-3.23).

Due to reluctance in reporting illegal activity on the part of those engaged, it is likely that employment related costs, remuneration, employment, jobs and hours worked related to these activities are under-reported in both business and household surveys and administrative records used in compiling both Australian National Accounts and Australian Labour Account statistics.

Although some illegal activity is within the 2008 SNA production boundary and may be reported to some extent by businesses, Australia does not specifically adjust for employment relating to illegal activity in the ASNA. Similarly, illegal activity is not adjusted for in the Australian Labour Account.

Scope of the population

Economically active population

The Australian Labour Account contains information about the economically active population who provide labour for economic production. The economically active population is defined as all persons who, during a specified time, contribute to or are available to contribute to the production of economic goods and services as defined by the 2008 SNA.

Population age

The scope of the population in the Australian Labour Account includes all persons who contribute to Australian economic activity, irrespective of age. This scope is consistent with the 2008 SNA.

The ILO standards and guidelines defining the labour force recognise the need to exclude persons below a certain age from the measures, without specifying a particular age limit. The responsibility for setting such limits lies with individual countries. Examples of factors influencing the age limit are:

  • legislation governing the minimum school leaving age;
  • labour laws setting the minimum age for entering paid employment;
  • the extent of the contribution to economic activity by young people; and
  • the cost and feasibility of accurately measuring this contribution in household surveys.

A maximum age limit is not a feature of the international guidelines but, for practical reasons, some countries do use a maximum age limit. The international guidelines also recognise the possible need, in the survey context, to exclude other population groups such as persons living permanently or semi-permanently in institutions.

Australia has adopted an age definition of 15 years and over in the Labour Force Survey, as is allowed within ILO standards and guidelines. Australian labour and compulsory schooling legislation have resulted in low numbers of young persons below this age being involved in economic activity. While such legislation varies from state to state, the net result is that age 15 is the lowest practical limit at which it is feasible and cost-effective to measure the participation of young people in economic activity with acceptable accuracy in a household based collection (i.e. the Labour Force Survey).

Employment data collected in ABS surveys of businesses relate to all persons employed in economic activity falling within the scope of the survey, regardless of age.

Scope differences in ABS surveys are adjusted for in the Australian Labour Account.

Australian Defence Forces

The Australian Labour Account includes permanent members of the Australian Defence Forces (ADF). This is consistent with the scope of the 2008 SNA.

The ILO international standards require that members of the armed forces be classified as employed and recommends that, for analytical purposes, the economically active population be divided into two parts: the armed forces and the economically active civilian population. The guidelines recognise that there may be difficulties in obtaining information about membership in the armed forces from labour force surveys, and that separate use of administrative counts may be necessary.

As a result of these recognised difficulties in obtaining data, Australia excludes permanent members of the armed forces from the Labour Force Survey and the related labour force estimates. Similarly, ANZSIC Class 7600 (Defence) is out of scope of relevant business surveys. Data on Australian defence force members are included in the Australian Labour Account to adjust for differences in scope between survey data and the ASNA.

Australian Defence Forces Reservists

ADF reservists are included in the current collection of the Labour Force Survey, and in the Australian Labour Account. Reservist jobs are considered as secondary jobs, should the reservist have a main job elsewhere.

Non-private dwellings

While some household surveys exclude all persons living in non-private dwellings, these persons are included in the Labour Force Survey and therefore in the Australian Labour Account.

Persons living in non-private dwellings include persons living in correctional and penal institutions, dormitories of schools and universities, religious institutions, hospitals, boarding houses, hotels and motels and so on. The exclusion of the institutional population in some household surveys is largely due to practical considerations of sampling.

Institutional units and sectors

The 2008 SNA defines an institutional unit as an economic entity that is capable, in its own right, of owning assets, incurring liabilities and engaging in economic activities and in transactions with other entities (2008 SNA, 4.2; ASNA, 4.3). There are two types of institutional units: Households and Legal or Social Entities (ASNA 4.6).

Households

A household is defined as a group of persons who share the same living accommodation, who pool some or all of their income and wealth, and who consume certain types of goods and services collectively, mainly housing and food (2008 SNA, 4.4; ANSA, 4.7). Households are providers of labour services.

Legal or social entities

A legal or social entity is defined as one whose existence is recognised by law or society independently of the persons or entities that may own or control it (2008 SNA, 4.6; ASNA, 4.10). In the Australian system, the legal entity unit is closest to the 2008 SNA concept of the institutional unit. However, in the ASNA, the unit used is the enterprise, which can be a single legal entity or a group of related legal entities that belong to the same institutional subsector. Four main types of institutional units are recognised in the 2008 SNA and the ASNA: households, non-profit institutions, government units and corporations (including quasi-corporations) (ANSA, 2.3).

The ASNA recognises corporations (incorporated and unincorporated), co-operatives, non-profit institutions, quasi-corporations and unincorporated government units (departments and agencies) as types of legal or social entity.

An enterprise is a view of an institutional unit as a producer of goods and services. The term enterprise may refer to a corporation, a quasi-corporation, a non-profit institution or an unincorporated enterprise (2008 SNA, 5.1).

Most enterprises consist of individual legal or social entities, or in some instances combinations of unincorporated legal or social entities. A household can constitute an enterprise where it undertakes economic activity that falls within the 2008 SNA production boundary.

An enterprise can be further subdivided into component production units where it engages in distinctive types of productive activity (multiple industries), at separate locations, e.g. a manufacturing plant and a wholesale outlet (2008 SNA, 5.2).

By creating jobs, enterprises generate demand for labour services.

The ABS has implemented these principles in the ABS Economic Units Model, which is used to determine the productive structure of Australian institutional units (ASNA, 4.31). The model consists of:

  • The Enterprise Group (EG) - essentially equivalent to the 2008 SNA enterprise concept (2008 SNA, 5.1). The group dimension recognises the reality that enterprises can consist of multiple legal or social entities under common control.
  • Legal Entities (LEs) - approximate the 2008 SNA concept of legal and social entities, but is extended to include households engaged in productive economic activity. 
  • Type of Activity Units (TAUs) - incorporate the industry homogeneity element of the 2008 SNA establishment, recognising that distinct activities such as manufacturing and retailing can be co-located. 
  • Location Units - incorporate the location element of the 2008 SNA establishment.

The Enterprise Group (EG) is an institutional unit that covers all the operations within Australia's economic territory of legal entities under common control. Control is defined in Corporations legislation. Majority ownership is not required for control to be exercised. 

The Legal Entity (LE) is an institutional unit covering all the operations in Australia of an entity which possesses some or all of the rights and obligations of individual persons or corporations, or which behaves as such in respect of those matters of concern for economic statistics. Examples of legal entities include companies, partnerships, trusts, sole (business) proprietorships, government departments and statutory authorities. Legal entities are institutional units. In most cases, the LE is equivalent to a single Australian Business Number (ABN) registration. 

The Type of Activity Unit (TAU) comprises one or more legal entities, sub-entities or branches of a legal entity that can report productive and employment activities. Type of Activity Units are created if accounts sufficient to approximate Gross Value Added are available at the Australian and New Zealand Standard Industrial Classification (ANZSIC) subdivision level. 

A Location is a producing unit comprised of a single, unbroken physical area from which an organisation is engaged in productive activity on a relatively permanent basis, or at which the organisation is undertaking capital expenditure with the intention of commencing productive activity on a relatively permanent basis at some time in the future. 

Institutional sectors

The institutional sectors of the 2008 SNA group together similar kinds of institutional units. Corporations, non-profit institutions, government units and households are intrinsically different from each other in that their economic objectives, functions and behaviour are different. Likewise, institutional units are allocated to sector according to the nature of the economic activity they undertake (2008 SNA, 4.16-4.17). 2008 SNA defines the following institutional sectors: 

1. Financial Corporations;
2. Non-financial Corporations;
3. General government;
4. Non-profit institutions serving households (NPISH);
5. Households; and
6. Rest of the World.

In the ASNA, the NPISH sector is combined with the household sector.

Industry

An industry consists of all establishments (in the Australian context, Type of Activity Units) in the economy engaged in the same, or similar, types of activity (2008 SNA, 5.2; ASNA, 2.10-2.14). Units in the same industry are generally characterised by common production functions, use of similar types of assets, intermediate inputs or the production of outputs sharing common characteristics (ASNA, 5.1). Typically, goods producing industries are distinguished from service producing industries; extractive industries (agriculture, forestry, fishing and mining) are distinguished from transformative industries (manufacturing and construction) and from distributive industries (transportation, wholesaling and retailing).

Type of Activity Units are classified to an industry using the Australian and New Zealand Standard Industrial Classification (ANZSIC, 2006 version), which is based on the current International Standard Industrial Classification (ISIC, revision 4).

In business surveys, data about jobs, both vacant and filled, hours paid for, labour costs and remuneration are collected at the Type of Activity Unit level, and are classified to the industry of the unit. This is also the unit level at which data are collected for compiling production (Gross Value Added) and generation of income accounts.

The Australian Labour Account provides data for each of the 19 industry divisions that represent the highest level of the ANZSIC and a subset of data for each of the 86 subdivisions. ANZSIC division codes and titles are:

A Agriculture, Forestry and Fishing
B Mining
C Manufacturing
D Electricity, Gas, Water and Waste Services
E Construction
F Wholesale Trade
G Retail Trade
H Accommodation and Food Services
I Transport, Postal and Warehousing
J Information Media and Telecommunications
K Financial and Insurance Services
L Rental, Hiring and Real Estate Services
M Professional, Scientific and Technical Services
N Administrative and Support Services
O Public Administration and Safety
P Education and Training
Q Health Care and Social Assistance
R Arts and Recreation Services
S Other Services

Economic territory and residency

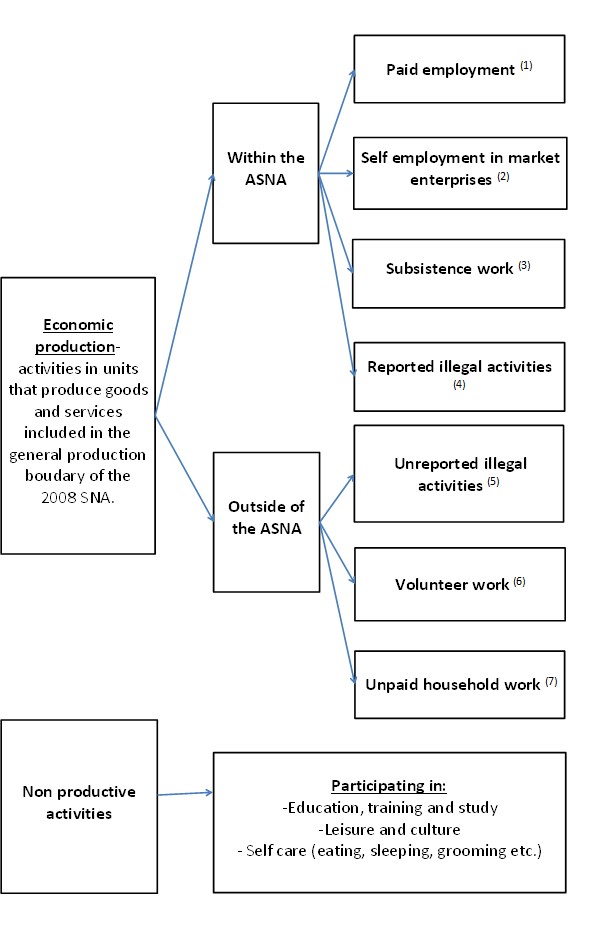
The production of meaningful statistics about the economically active population requires that the economic territory to which the population relates is accurately defined.

The concept of economic territory in the 2008 SNA is not identical to the concept of country. The most commonly used definition is a territory under the effective economic control of a single government, and as such usually approximates the geographic borders of a country.

In principal, the economic territory of Australia as defined in the ASNA includes the geographic territory under the effective control of the Australian government, including:

  • any islands belonging to Australia which are subject to the same fiscal and monetary authorities as the mainland;
  • the land area, airspace, territorial waters, and continental shelf lying in international waters over which Australia enjoys exclusive rights or over which it has, or claims to have, jurisdiction in respect of the right to fish or to exploit fuels or minerals below the sea bed; and
  • territorial enclaves in the rest of the world (that is, geographic territories situated in the rest of the world and used, under international treaties or agreements, by general government agencies of the country). Territorial enclaves include embassies or consulates, military bases, scientific stations, etc. It follows that the economic territory of Australia does not include the territorial enclaves used by foreign governments which are physically located within Australia’s geographical boundaries.

Specifically, the economic territory of Australia consists of geographic Australia including Cocos (Keeling) Islands, Christmas Island, Norfolk Island, Jarvis Bay, Australian Antarctic Territory, Heard Island and McDonald Islands, Territory of Ashmore Reef and Cartier Island, and the Coral Sea Islands.

Within the Australian labour household surveys context, a distinction must be made between: the territories which determine the estimated resident population of Australia; those which are covered by household survey collection procedures; and those used to benchmark or ‘weight’ household survey estimates (i.e., the population benchmarks). See Information Paper: Improved Methods for Estimating Net Overseas Migration, 2006.

  • The “other territories” of Australia, namely Jervis Bay, Christmas Island, Cocos (Keeling) Island, and Norfolk Island after the 2016 Census, are included in the estimated resident population of Australia, but excluded from household survey collection procedures and population benchmarks.
  • The “external territories” of Australia, namely Territory of Ashmore and Cartier Islands, Coral Sea Islands Territory, Australian Antarctic Territory, and Territory of Heard and McDonald Islands, are not included in the estimated resident population, household survey collection procedures or the population benchmarks.

Within the Australian labour business surveys context, no further geographical restrictions are imposed. Samples for business surveys are typically selected from the ABS Business Register, and therefore all businesses within the economic territory of Australia may be included, providing they meet other relevant scope restrictions.

Residency

Within the 2008 SNA, residency is defined as the economic territory with which an institutional unit or individual has the strongest connection - in other words, its centre of predominant economic interest. Each institutional unit or individual is a resident of one and only one economic territory.

Actual or intended residence for one year or more is used as an operational definition in many countries (including Australia) to facilitate international comparability.

Residence of individuals and households

Persons are considered to have the strongest connection with the economic territory in which they physically reside. In the broadest sense, the total population consists of either all usual residents of the country (the usually resident or de jure population) or all persons present in the country (the de facto population) at a particular time.

Household surveys use the first population category, the usually resident population. All persons who are usually resident in Australia are considered part of the usually resident population, regardless of nationality, citizenship or legal status.

To determine whether a person is usually resident, Australia has adopted a 12 in 16 month rule. This rule specifies that, to be considered a usual resident, a person must have been (or expect to be) residing in Australia for 12 months or more in a 16 month period. This 12 month period does not need to be consecutive.

The application of the 12 in 16 month rule in the labour household survey context cannot be so precise. A screening question asks if the respondent is a short term resident and, if so, they are excluded from the survey. Labour household surveys also include residents who are temporarily overseas for less than six weeks. However, the 12 in 16 month rule is explicitly applied in the estimated resident population, and the population benchmarks used to weight the LFS. For more information regarding the 12 in 16 month rule, refer to Information Paper: Improved Methods for Estimating Net Overseas Migration, 2006 (cat. no. 3107.0.55.003).

Residence of students

In the 2008 SNA, the residence of students is described as:

"…people who go abroad for full-time study generally continue to be resident in the territory in which they were resident prior to studying abroad. This treatment is adopted even though their course of study may exceed a year. However, students become residents of the territory in which they are studying when they develop an intention to continue their presence in the territory of study after the completion of the studies."

Within the Australian labour household survey context, there is no special treatment for students and they are treated using the same 12 in 16 month rule. Within the Australian business survey context, there is no distinction made between students and other persons, such that they are included if they are an employee, irrespective of their length of stay in the country.

Residence of enterprises

Within the labour business survey context, the de facto population is used, that is, all employees are included irrespective of their length of stay in the country. This is consistent with the SNA production boundary.

As a general principle, an enterprise is resident in an economic territory when it is engaged in a significant amount of production of goods or services from a location in the territory.

An enterprise is resident in an economic territory when there exists, within the economic territory, some location, dwelling, place of production, or other premises on which or from which the unit engages and intends to continue engaging, either indefinitely or over a finite but long period of time, in economic activities and transactions on a significant scale. The location need not be fixed, so long as it remains within the economic territory.

Corporations and non-profit institutions normally may be expected to have a centre of economic interest in the economy in which they are legally constituted and registered. Corporations may be resident in economies different from their shareholders, and subsidiaries may be resident in different economies from their parent corporations. When a corporation, or unincorporated enterprise, maintains a branch, office, or production site in another territory to engage in a significant amount of production over a long period of time (usually one year or more) but without creating a corporation for the purpose, the branch, office, or site is considered to be a quasi-corporation (i.e., a separate institutional unit) resident in the territory in which it is located.

Within the Australian business survey context, residency is determined by deriving the sample selection of business frames from the Australian Business Register, which is an administrative data source maintained by the Australian Taxation Office (ATO). The registration of a business by the ATO is deemed to be a demonstration that the business has a centre of economic interest within Australia.

Residency in the Australian Context

Applying residency concepts to survey collections:

Business surveys:

  • include non-residents living in Australia employed by Australian companies, such as short-term foreign students studying in Australia for periods of less than 12 months.
  • include estimates of non-resident persons engaged by Australian businesses operating overseas that have no intention to stay in the non-resident country for more than 12 months.

Household surveys:

  • include Australian residents living in Australia employed by non-resident enterprises, for example Australians engaged by foreign embassies and consulates and by overseas companies that have no intention of staying in Australia for more than 12 months.
  • do not include estimates of non-resident persons engaged by Australian businesses operating overseas, that have no intention to stay in the non-resident country for more than 12 months.

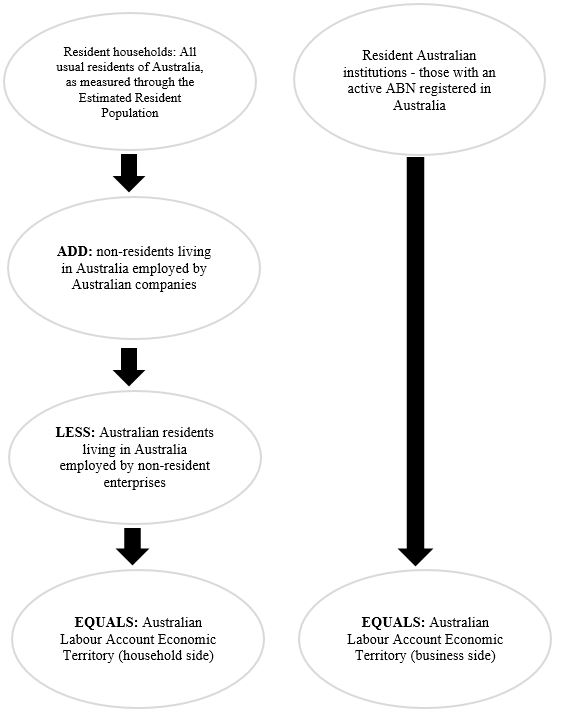
Applying residency concepts in practice, the Australian Labour Account makes the following scope adjustments to household survey estimates:

  • add: non-residents living in Australia employed by Australian companies. Non-residents such as short-term foreign students studying in Australia for periods of less than 12 months, short-term migrants and working tourists are included because they contribute to Australia’s economic production and are included in the Compensation of Employees component of Gross Domestic Product (GDP).
  • less: Australian residents living in Australia employed by non-resident enterprises, for example Australians engaged by foreign embassies and consulates and by overseas companies that have no intention of staying in Australia for more than 12 months.

The Australian Labour Account does not include estimated numbers of non-resident persons engaged by Australian businesses operating overseas, but with no intention to stay in the non-resident country for more than 12 months. While conceptually included in the scope of the Australian Labour Account, due to lack of data no estimate has been included for the foreign workers they may employ.

The economic territory used in the Australian Labour Account is summarised below.

Australian Labour Account economic territory

Australian Labour Account economic territory
The diagram shows that resident households (all usual residents of Australia as measured through the Estimate Resident Population), PLUS non-residents living in Australia employed by Australia companies, LESS Australian residents living in Australia employed by non-resident enterprises, EQUALS Australian Labour Account economic territory (household side). Resident Australian institutions - those with an active ABN registered in Australia EQUALS Australian Labour Account economic territory (business side).

Labour Account sources

Different data sources have been used in compiling the four quadrants of the Australian Labour Account. In general, the same data sources have been used to compile both quarterly and annual labour account estimates. Quarterly survey estimates have also been benchmarked to annual survey estimates where possible.

Australian Labour Account data at an industry level are derived where possible from data classified by industry reported in both business and household surveys. Where Australian Labour Account data at an industry level are not reported in surveys, the industry detail has been modelled using alternative sources.

The Australian Labour Account uses both published and unpublished data from various sources. These are detailed below.

SourceQuadrantData ItemData item detailPublication Status
Job Vacancies SurveyJobsJob VacanciesJob vacanciesPublished data
Internet Vacancy Index (Department of Employment, Skills, Small and Family Business)JobsJob VacanciesJob vacanciesUnpublished data
Economic Activity Survey (EAS)JobsFilled Jobs (Business Sources)Private sectorPublished data
Quarterly Business Indicators Survey (QBIS)JobsFilled Jobs (Business Sources)Private sectorUnpublished data
Survey of Employment and Earnings (SEE)JobsFilled Jobs (Business Sources)Public sectorUnpublished data for industry
Wage and Salary Earners, AustraliaJobsFilled Jobs (Business Sources)Used for backcastingPublished data
Quarterly Business Indicators Survey (QBIS)JobsAdjustments to Filled Jobs (Business Sources)Industry scope adjustmentUnpublished data
Business Register Unit (ABS)JobsAdjustments to Filled Jobs (Business Sources)Industry scope adjustmentUnpublished data
National AccountsJobsAdjustments to Filled Jobs (Business Sources and Household Sources)Defence personnelUnpublished data
Labour Force Survey (LFS), monthly, detailedJobsAdjustments to Filled Jobs (Business Sources)Contributing Family WorkersPublished data
Child Employment Survey (2006)JobsAdjustments to Filled Jobs (Business Sources and Household Sources)Child workersPublished and Unpublished data
Labour Force Survey (LFS), monthly, detailedJobsFilled Jobs (Household Sources)Base numberPublished data
Labour Force Survey (LFS), quarterlyJobsFilled Jobs (Household Sources)Industry distributionPublished data
Labour Force Survey (LFS), monthlyJobsFilled Jobs (Household Sources)Labour Force Survey Main JobPublished data
National AccountsJobsAdjustments to Main JobDefence personnelUnpublished data
Migration, AustraliaJobsAdjustments to Main JobNon-residents living in Australia employed by Australian companies/business entities : Main job students and Main job non-studentsUnpublished data
Overseas Arrivals and Departures, AustraliaJobsAdjustments to Main JobNon-residents living in Australia employed by Australian companies/business entities : Main job students and Main job non-studentsUnpublished data
Balance of Payments (ABS)JobsAdjustments to Main JobAustralian residents living in Australia and employed by oversees companies/business entitiesUnpublished data
Child Employment Survey (2006)JobsAdjustments to Main JobChild workersPublished and Unpublished data
Labour Force Survey (LFS), monthlyJobsLabour Force Survey Secondary JobLabour Force Survey Secondary JobUnpublished data
Migration, AustraliaJobsAdjustments to Secondary JobNon-residents living in Australia employed by Australian companies/business entities - secondary jobUnpublished data
Overseas Arrivals and Departures, AustraliaJobsAdjustments to Secondary JobNon-residents living in Australia employed by Australian companies/business entities - secondary jobUnpublished data
Linked Employer Employee Database (LEED)JobsSecondary jobsIndustry of employment, secondary jobsPublished and Unpublished data
Labour Force Survey (LFS), monthlyPersonsLabour Force Survey Employed PersonsLabour Force Survey Employed PersonsPublished data
National AccountsPersonsAdjustments to Employed PersonsDefence personnelUnpublished data
Migration, AustraliaPersonsAdjustments to Employed PersonsNon-residents living in Australia employed by Australian companies/business entitiesUnpublished data
Overseas Arrivals and Departures, AustraliaPersonsAdjustments to Employed PersonsNon-residents living in Australia employed by Australian companies/business entitiesUnpublished data
Balance of Payments (ABS)PersonsAdjustments to Employed PersonsAustralian residents living in Australia employed by overseas companies/business entitiesUnpublished data
Child Employment Survey (2006)PersonsAdjustments to Employed PersonsChild WorkersPublished and Unpublished data
Labour Force Survey (LFS), monthlyPersonsLabour Force Survey UnemployedLabour Force Survey UnemployedPublished data
Labour Force Survey (LFS), monthlyPersonsLabour Force Survey Underemployed PersonsLabour Force Survey Underemployed PersonsPublished data
Labour Force Survey (LFS), monthlyPersonsLabour Force Survey Underutilised PersonsLabour Force Survey Underutilised PersonsPublished data
Labour Force Survey (LFS), monthlyPersonsLabour Force Survey Not in the Labour ForceLabour Force Survey Not in the Labour ForcePublished data
Labour Force Survey (LFS), monthlyVolumeLabour Account Hours Actually Worked in All JobsHours actually worked in all jobsUnpublished data
Survey of Employee Earnings and Hours (EEH)VolumeLabour Account Hours Paid ForHours paid forUnpublished data
Survey of Employee Earnings and Hours (EEH)VolumeLabour Account Ordinary HoursOrdinary hoursUnpublished data
Survey of Employee Earnings and Hours (EEH)VolumeLabour Account Overtime HoursOvertime hoursUnpublished data
National AccountsVolumeAdjustments to hours actually worked in all jobsHours actually worked by Defence personnelUnpublished data
Migration, AustraliaVolumeAdjustments to hours actually worked in all jobsHours actually worked by non-residents living in Australia employed in AustraliaUnpublished data
Overseas Arrivals and Departures, AustraliaVolumeAdjustments to hours actually worked in all jobsHours actually worked by non-residents living in Australia employed in AustraliaUnpublished data
Child Employment Survey (2006)VolumeAdjustments to hours actually worked in all jobsHours actually worked by child workersPublished and Unpublished data
Balance of Payments (ABS)VolumeAdjustments to hours actually worked in all jobsHours actually worked by Australian residents living in Australia employed by overseas companies/business entitiesUnpublished data
Labour Force Survey (LFS), quarterlyVolumeHours Sought by UnemployedHours sought by UnemployedPublished and Unpublished data
Labour Force Survey (LFS), quarterlyVolumeAdditional Hours Sought by UnderemployedAdditional hours sought by UnderemployedPublished and Unpublished data
National AccountsPaymentsCompensation of EmployeesCompensation of EmployeesUnpublished data
National AccountsPaymentsWages and SalariesWages and SalariesUnpublished data
National AccountsPaymentsEmployers' Social ContributionsEmployers' Social ContributionsUnpublished data
Wage and Salary Earners, AustraliaPaymentsCompensation of EmployeesUsed to backcast Compensation of EmployeesPublished data
National AccountsPaymentsEmployers' Payroll taxesEmployers' Payroll taxesUnpublished data
National AccountsPaymentsRecruitment CostsRecruitment CostsPublished and Unpublished data
Job Vacancies SurveyPaymentsRecruitment CostsRecruitment CostsPublished data
National AccountsPaymentsTraining CostsTraining CostsPublished and Unpublished data
Quarterly Business Indicator SurveysPaymentsTraining CostsTraining CostsPublished data
Government Finance Statistics (GFS)PaymentsEmployment subsidiesEmployment subsidiesUnpublished data
National AccountsPaymentsLabour income from self-employmentLabour income from self-employmentUnpublished data

Labour Account methods

Compilation methods

The Australian Labour Account data tables are compiled using different methods, namely interpolation, extrapolation, backcasting and benchmarking. Methods chosen are based on two factors: the context in which the data were originally collected, and ability to fill data gaps between collection points or reference periods.

Interpolation

Interpolation is a method of constructing new data points within the range of a discrete set of known data points. Where interpolation is used in the Australian Labour Account, it is generally designed to create a quarterly series between two annual data points when data with a quarterly frequency are not available. An example of this is measuring the number of public sector jobs, where quarterly data are estimated from two annual data points.

Extrapolation

Extrapolation is the process of estimating values of a variable beyond its original observed range. Some estimates in the labour account are derived by extrapolating data using various indicators, as information necessary to compile a comprehensive and complete account may not be sufficiently timely. For example, as there is a time lag between the current reference period and the release of Government Finance Statistics (GFS), data for employment subsidies in the Australian Labour Account are extrapolated forwarded based on the movements of previously observed data.

Backcasting

Backcasting is the process of estimating values of a variable prior to its original observed range, usually through analysing the growth rates or proportional distribution of a conceptually related series. In addition, some estimates for earlier time periods in the Australian Labour Account are backcast from partially observed information. For example, data from the Job Vacancies Survey are not available on the current industry classification prior to 2009, however the total number of job vacancies is known. Data on the current industry classification for earlier time periods have been backcast using by applying a concordance between the previous and current industry classifications, with the additional constraint that the known total number of job vacancies must be maintained.

Benchmarking

Benchmarking is the processes of combining sub-annual (quarterly) indicator data and annual data, and aligning them to produce quarterly economic data that combine the robustness of the annual ‘benchmark’ source while reflecting the pattern of sub-annual movement. Benchmarks (or annual data) are usually of higher quality because they come from annual surveys, which draw on more complete source data (e.g. balanced and audited company financial accounts), conduct more detailed enquiries, and generally have larger sample sizes. To create a quarterly series, the annual data provides the overall levels, to which a conceptually related quarterly indicator series is benchmarked. An example of this in the Australian Labour Account is estimating private sector filled jobs by benchmarking quarterly jobs data to annual data.

There are a number of methods used to benchmark flow data, depending on the type of data to be benchmarked. The method used the majority of the time, due to its accuracy and ease of implementation, is the ‘Proportional Denton Method’. This method preserves the movement of the quarterly data by minimising the absolute difference in the relative adjustments of two neighbouring quarters (i.e. keeping the benchmarked data to indicator data ratio as constant as possible over the time series), under the constraint that the sum of the quarters is equal to the annual data for each benchmark year.

The Australian Labour Account uses a modified Proportional Denton Method to benchmark the Quarterly Business Indicators Survey (QBIS) industry data to the annual industry data from the Economic Activity Survey (EAS).

The standard Proportional Denton Method is modified for use in the Australian Labour Account in the following ways:

  • the Proportional Denton Method is generally used only in relation to flow data. In the Australian Labour Account, the mathematics underlying the Proportional Denton method have been modified to apply to stock data;
  • the Proportional Denton Method is generally not used to extrapolate data series beyond their observed range. In the Australian Labour Account, annual industry data from the EAS, which are not yet available, have been extrapolated for the latest year as part of the modified Proportional Denton Method by assuming a benchmark data to indicator data ratio of one;
  • in the context of flow data, the annual benchmark data measures a variable over an entire year and so should (theoretically) be equal to the sum of the four indicator data points for that year. In contrast, stock data measure a variable at a single point in time, and the annual stock benchmark data could simply be considered a more accurate measure of the indicator data of that quarter. The modified Proportional Denton Method used in the Australian Labour Account imposes an additional constraint for stock estimates, that the benchmarked quarterly data must be equal to the annual benchmark data in the June quarter of each year while maintaining, as much as possible, the quarterly movements of the indicator data.

For more information regarding the Proportional Denton Method, refer to paragraph 7.40 in the Australian System of National Accounts: Concepts, Sources and Methods.

Annual Australian Labour Account data

Data in the Australian Labour Account are compiled with quarterly estimates as the primary level of data compilation, with annual estimates subsequently produced from quarterly data. The method used to annualise data varies for each quadrant, depending on whether data are stock or flow estimates.

Stock data

The Jobs and Persons quadrants contain stock data, which are data that measure certain attributes at a point in time. Data in these quadrants are annualised using a simple arithmetic average of the four quarterly estimates. While these average annual levels are not true stock values, in the sense that they are not measured at a specific point in time, the purpose of presenting annual estimates as an arithmetic average is to minimise issues with using any particular quarterly observation to represent an annual stock, as any particular quarterly observation may under or over represent “usual” stock levels for a particular year. This is particularly relevant for industries which exhibit strongly seasonal employment levels, for example retail trade.

For example, consider the example below of two industries which exhibit the following patterns in employed persons over a one year period.

Time periodIndustry A – employed persons (000’s)Industry B – employed persons (000’s)
Sep-15115220
Dec-15120300
Mar-16125230
Jun-16130220
2015-16 annual average123243

The annual average stock level for 2015-16 for Industry A is 123 thousand employed persons. The choice of using an annual average, an end of year stock level (of 130 thousand employed persons) or a mid-point stock level (of 120 thousand employed persons) for this industry does not significantly change the annual level of employed persons.

For Industry B, which shows a strong cyclical increase in employed persons each December, the choice of annual stock level is more significant. If an annual average stock level (of 243 thousand employed persons in 2015-16) or end of year stock level (of 220 thousand employed persons) were chosen, a much lower annual stock level would result than if a mid-point stock level (of 300 thousand employed persons) were used.

Flow data

The Labour Volume and Labour Payments quadrants contain flow data, which represent a measure of activity over a given period. Data in these quadrants are annualised as the sum of the four quarterly estimates.

Seasonal adjustment

Any original time series can be thought of as a combination of three broad and distinctly different types of behaviour, each representing the impact of certain types of real world events on the information being collected: systematic calendar related events, short-term irregular fluctuations and long-term cyclical behaviour.

Seasonal adjustment is a statistical technique that attempts to measure and remove the effects of systematic calendar related patterns including seasonal variation to reveal how a series changes from period to period. Seasonal adjustment does not aim to remove the irregular or non-seasonal influences, which may be present in any particular data series. This means that movements of the seasonally adjusted estimates may not be reliable indicators of trend behaviour.

The ABS software for seasonal adjustment is the SEASABS (SEASonal analysis, ABS standards) package, a knowledge based seasonal analysis and adjustment tool. The seasonal adjustment algorithm used by SEASABS is based on the X-11 Variant seasonal adjustment software from the U.S. Census Bureau.

Trend estimates

In cases where the removal of only the seasonal element from an original series (resulting in the seasonally adjusted series) may not be sufficient to allow identification of changes in its trend, a statistical technique is used to dampen the irregular element. This technique is known as smoothing, and the resulting smoothed series are known as trend series.

Smoothing, to derive trend estimates, is achieved by applying moving averages to seasonally adjusted series. A number of different types of moving averages may be used; for quarterly series a seven term Henderson moving average is generally applied by the ABS. The use of Henderson moving averages leads to smoother data series relative to series that have been seasonally adjusted only. The Henderson moving average is symmetric, but asymmetric forms of the average may be applied as the end of a time series is approached. The application of asymmetric weights is guided by an end weight parameter, which is based on the calculation of a noise-to-signal ratio (i.e. the average movement in the irregular component, divided by the average movement in the trend component). While the asymmetric weights enable trend estimates for recent periods to be produced, they result in revisions to the estimates when subsequent observations are available.

Revisions to trend series may arise from:

  • the availability of subsequent data;
  • revisions to the underlying data;
  • identification of and adjustment for extreme values, seasonal breaks and/or trend breaks;
  • re-estimation of seasonal factors; and
  • changes to the end weight parameter.

For more information about ABS procedures for deriving trend estimates and an analysis of the advantage of using them over alternative techniques for monitoring trends, see Information Paper: A Guide to Interpreting Time Series - Monitoring Trends.

In the Australian Labour Account, quarterly tables are produced in original, seasonally adjusted and trend terms. For the purpose of deriving the annual average level from quarterly stocks of jobs and employed persons using an arithmetic average, original quarterly series are used.

Balanced tables

After adjusting for conceptual and scope differences between data sources, a statistical discrepancy remains between the number of filled jobs as reported by businesses and the number of filled jobs as reported by households.

These discrepancies represent the cumulative impact of data source error, including survey error, and modelling error. Survey error includes both sampling error and non-sampling error. Sampling error is the predictable variability arising from the use of samples, rather than a complete enumeration of the populations of enterprises and households. Non-sampling error is all other error present in an estimate, and includes:

  • Error arising from the reliability of the survey population and related benchmark data, e.g. the accuracy, completeness and timeliness of the Business Register from which business survey samples are drawn, or the reliability of Estimated Resident Population data used in benchmarking the Labour Force Survey;
  • Error arising from data used in the estimation and imputation procedures applied in both business and household surveys;
  • Error embedded in the estimation and imputation models used in surveys, for example incorrect assumption that missing firm data is similar to that of reporting firms of comparable size in the same industry; and
  • Error made by respondents in reporting data - for example, the Labour Force Survey relies on one responsible adult in each household to accurately report on the employment status of all other adults in the household, including industry of employment and hours worked in the survey reference week. Industry can be misreported where people are employed by labour hire firms, but actually work in other industries such as Mining, Construction or Manufacturing.

Error can occur in non-survey data sources, such as missing data or misclassification in government administrative records used directly in the Australian Labour Account. For example, error could occur in the industry classification of sponsored visa holders, or in the reported number of persons in the permanent defence forces.

Modelling error reflects errors embedded in the modelling assumptions used in the Australian Labour Account, for example in assuming that the proportion of children aged under 15 years who work has remained constant since 2006, or in assuming that Quarterly Business Indicators Survey employment movements accurately reflect quarterly change in the latest available annual data.

The balanced Australian Labour Account estimates apply knowledge of the known strengths and weaknesses of data sources and methodologies, to derive a single estimate of the number of filled jobs.

The balanced estimate of numbers of filled jobs impacts on other data in the Australian Labour Account that incorporate that estimate in their calculation. This includes balanced estimates of numbers of persons employed, hours paid for and hours worked.

Two general observations about data source quality are relevant in deriving a balanced estimate of numbers of filled jobs:

  • Household estimates of numbers of filled jobs are considered more reliable at a total economy level. Household data are mainly sourced from the Labour Force Survey, which applies a consistent methodology and asks a consistent set of questions of a statistically robust sample of persons about the number of jobs held by employed persons in their household. By contrast, no single business survey covers the whole economy. Estimates of the total number of filled jobs from the business side are derived from three separate surveys (Economic Activity Survey, Survey of Employment and Earnings, and Quarterly Business Indicators Survey), supplemented by data obtained from the Australian Business Register. Each source has a different methodology, a different sample, and asks different questions. Adjustments are required to counter overlap. Growth in household side filled jobs is more consistent over time with growth in related economic data (Gross Domestic Product and Compensation of Employees) at a total economy level than growth in business side data.
  • Business sources are considered more reliable in estimating the distribution of jobs across industries. The numbers of filled jobs reported by each business survey respondent are automatically coded to the industry classification of that business. This implies that labour input is correctly linked to related production, employment related costs and compensation.

Whilst additional considerations are taken into account at the industry level, the balanced estimate of filled jobs generally incorporates the advantage of the industry distribution derived from business side data, within a total economy estimate sourced from household side data.

Revisions in the Australian Labour Account

Revisions are a change in the value of a published estimate. Revisions arise from the correction of errors, the incorporation of more up-to-date data, reassessment of seasonal factors, and from time to time the introduction of new concepts or improved data sources and methods.

Revisions are an inevitable consequence of the process of producing the Australian Labour Account. Revisions reflect both the complexity of measurement, and the need to trade off some level of precision in order to provide timely estimates, to maximise their use in analysis of current economic conditions.

Quarterly revisions

  • Updates to the Estimated Resident Population (ERP), usually affecting the latest eight quarters of data, resulting in quarterly revisions to the Labour Force Survey statistics on persons, jobs and hours worked;
  • Revisions to Quarterly Business Indicator Survey statistics on filled jobs, arising from replacement of imputed data with actual responses following late receipt of survey questionnaires; and
  • Revisions to previously published seasonally adjusted and trend series, which will be revised to incorporate the seasonal effects of the latest quarterly data. This process is referred to as concurrent seasonal adjustment.

Annual revisons

  • Revisions which reflect the cumulative impact of previous revisions to quarterly data;
  • Revisions to Economic Activity Survey statistics on filled jobs, arising from replacement of imputed data with actual responses following late receipt of survey questionnaires;
  • Revisions to Compensation of Employees and Gross Mixed Income following annual benchmarking of the Australian National Accounts, usually affecting the latest three years of quarterly data; and
  • Revisions to expenditure on recruitment services and training, following release of updated Input-Output Tables.

Other periodic revisions

  • Five yearly post-Census benchmarking of ERP, resulting in revisions to the household Labour Force Survey statistics on persons, jobs and hours worked; and
  • Revisions to Compensation of Employees and Gross Mixed Income arising from scheduled National Accounts historical revisions, potentially affecting quarterly data back to 1960.

Ad hoc revisions

  • All data sources can be subject to revisions arising from the correction of errors. These can include data capture and compilation errors, mistakes in classification, or respondent misreporting; and
  • Australian Labour Account data are also subject to revision arising from internal compilation errors.

ABS and international data quality assessment frameworks include revisions history as one of the indicators of quality. A revisions history assists users in assessing the probability and potential scale of change to published data. The ABS publishes revisions to previously published data with each quarterly update of the Australian Labour Account.

Jobs quadrant

The Jobs quadrant provides data on the number of jobs, both filled and vacant. Estimates from business surveys are balanced with estimates from household surveys.

Jobs quadrant

Jobs quadrant
The diagram shows that in the Jobs quadrant: Number of main jobs plus Number of secondary jobs equals Filled jobs. Filled jobs plus Job vacancies equals Total jobs.

Jobs concepts

The concept of a “job” is central to the Australian Labour Account. It is the mechanism through which people engage in production.

The Oxford English Dictionary has multiple meanings for the word, one of which approximates the concept as it is applied in the Australian Labour Account and the 2008 System of National Accounts (2008 SNA) – “a task or piece of work, especially one that is paid”.

The 2008 SNA does not explicitly define a job. Rather, it observes the agreement between an employee and the employer defines a job, and each self-employed person has a job (2008 SNA, 19.30). In application, a self-employed person is both the employer and employee. A job is position held by a person that involves work, duties or responsibilities; it may or may not provide returns of compensation or benefits to the individual.

As the dictionary definition implies, not all jobs are paid, either in money or in kind. People can be engaged in productive economic activity within an institutional unit for no apparent reward, in which case they are contributing to output but receiving no compensation. The 2008 SNA concept of a job includes these people as volunteer labour (2008 SNA, 19.39).

Jobs are created by enterprises. In the case of the self-employed person, the International Labour Organisation (ILO) defines these jobs as those where the remuneration is directly dependent upon the profits (or the potential for profits) derived from the goods and services produced (where own consumption is considered to be part of profits). The incumbents make the operational decisions affecting the enterprise, or delegate such decisions while retaining responsibility for the welfare of the enterprise. In this context, "enterprise" includes one person operations.

In summary, and in the context of the Australian Labour Account, a job is a set of production related tasks that can be assigned to and undertaken by a person, and for which they are usually, but not necessarily, remunerated either in money or in kind.

Production related tasks are constrained to economic activity within the 2008 SNA production boundary, and jobs are created and maintained by institutional units (Type of Activity Units within Enterprise Groups in the Australian context).

The Australian Labour Account includes all jobs created and maintained by institutional units (that is, households, legal entities and social entities) resident in Australian economic territory, involving economic activity within the Australian application of the 2008 SNA production boundary.

Estimates of movements in the number of jobs in the economy provide a measure of labour market performance and capacity.

Jobs characteristics

Jobs can be classified according to:

  • inherent job characteristics (e.g. whether the job is full-time or part-time),
  • characteristics of the person holding the job (e.g. whether the job is filled by a self-employed person or an employee), or
  • characteristics of the enterprise creating the job (e.g. the industry or institutional sector to which the job relates).

Status in employment

In the Australian context, self-employment according to the ILO definition is not separately identified. Rather, jobs are distinguished according to the status in employment categories of the people filling the job.

These categories include:

  • Employee;
  • Owner manager of incorporated enterprise with employees;
  • Owner manager of incorporated enterprise without employees;
  • Owner manager of unincorporated enterprise with employees;
  • Owner manager of unincorporated enterprise without employees; and
  • Contributing family workers.

The closest approximation to the ILO concept of self-employment in the Australian context is the aggregation of the four “owner manager” status in employment categories.

Employees

Employees are those employed persons who do not operate their own incorporated or unincorporated enterprise. An employee works for a public or private employer and receives remuneration in wages, salary, on a commission basis (with or without a retainer), tips, piece rates, or payment in kind.

Owner managers of incorporated enterprises

An owner manager of an incorporated enterprise is a person who operates his or her own incorporated enterprise, that is, a business entity which is registered as a separate legal entity to its members or owners (also known as limited liability company).

An owner manager of an incorporated enterprise (an OMIE) may or may not hire one or more employees in addition to themselves and/or other owners of that business.

Owner managers of unincorporated enterprises

In the Australian Labour Account, own-account workers and employers employed in their own enterprises are referred to as Owner Managers of Unincorporated Enterprises (OMUEs). OMUEs are persons who operate their own unincorporated enterprise, or engage independently in a profession or trade. An owner manager of an unincorporated enterprise may or may not hire one or more employees in addition to themselves and/or other owners of that business.

Contributing family workers

A contributing family worker is a person who works without pay in an economic enterprise operated by a relative. Contributing family workers, including those working without pay in unincorporated enterprises engaged wholly or partly in market production, are also treated as self-employed (2008 SNA, 7.30b).

The ILO defines a contributing family worker as a person who holds a self-employment job in an enterprise operated by a related person, and who cannot be regarded as a partner because the degree of his or her commitment to the operation of the enterprise, in terms of the working time or other factors to be determined by national circumstances, is not at a level comparable with that of the head of the establishment.

Internationally the concept is restricted to those living in the same household, however Australia has not applied the same criteria of cohabitation in its implementation. For example, an adult child who makes unpaid contributions of labour to a family business operated by their parents, and does not live in the same household as the parents, is still considered to be a contributing family worker.

Own-account workers engaged in the production of goods exclusively for own final use by their household (such as subsistence farming or do-it-yourself construction of own dwellings), are considered employed according to the definition of employment adopted by Thirteenth International Convention of Labour Statisticians (ICLS). Households producing unpaid domestic or personal services (e.g., housework, caring for family members) for their own final consumption are excluded, as such activities fall outside the 2008 SNA production boundary and are not considered employment.

Jobs in the Australian Labour Account

Jobs which are in and out of scope of the Australian Labour Account are summarised in the table below.

Jobs in scopeJobs out of scope
Paid employment with formal work agreements – i.e. an employer/employee relationship.Positions which are purely voluntary and no remuneration is received, either in cash or in kind.
Owner managers of businesses – i.e. self-employed persons.Activities relating to the production of unpaid domestic services.
Unpaid contributions of labour to a family business or farm – i.e. contributing family workers.Activities and positions outside of Australia’s economic territory.
Activities relating to the production of goods for own consumption.Activities relating to unreported illegal transactions.

Jobs and persons

The number of jobs in the economy exceeds the number of persons employed, to the extent that some employed persons have more than one job in the same period. An individual with more than one job may do these successively, as when the person works for part of the week in one job and the rest of the week in another, or in parallel, as when the person has an evening job as well as a daytime job. In addition, the number of jobs in the economy may be reduced when compared to the number of persons employed in instances of formal job sharing arrangements.

Employers may not be aware of, and in any case are not asked to provide information on, secondary jobs undertaken by their employees. When employers supply information on the number of employees, they actually provide information on the number of jobs they hold. This is because the same employee would be reported separately by each employer. The distinction between the number of jobs and the number of employed persons is one issue that is informed by the Australian Labour Account.

The Australian Labour Account recognises this difference by accounting for multiple job holding, and reports the number of jobs in the Jobs quadrant and employed persons in the Persons quadrant. However, the Australian Labour Account does not compile estimates of formal job sharing, as there is currently no available data source to measure this, and it is particularly unlikely to be reported accurately by businesses.

The statistics derived from the Labour Force Survey are designed to produce estimates of the number of people engaged in economic activity. The statistics derived from ABS business surveys count the number of jobs in which people are employed. For example, a person holding multiple jobs with different employers would be counted once in ABS household surveys as an employed person, but in ABS business surveys would be counted multiple times, once by each employer for each job that they held.

A number of examples illustrate this:

  • if an unemployed person became employed full-time (by starting one full-time job), then the full-time employment estimate from the Labour Force Survey would increase by one (in a business survey, or a 'filled jobs' count, this would lead to an increase in the filled jobs estimate by one);
  • if an unemployed person became employed full-time (by starting two part-time jobs with a total of 35 hours of work or more per week), then the full-time employment estimate from the Labour Force Survey would increase by one (however, in a business survey, or a 'filled jobs' count, this would lead to an increase in the filled jobs estimate by two);
  • if a person who was already employed in one part-time job took on another part-time job, this would have differing impacts on the employment estimates from the Labour Force Survey depending on the total number of hours worked: if the sum of hours worked in the two part-time jobs was fewer than 35 hours per week, the employment estimates from the Labour Force Survey would remain unchanged, but if the sum of hours worked was 35 hours or more, the employment estimates from the Labour Force Survey would show a decrease of one in part-time employment and an increase of one in full-time employment (however, in both cases this would lead to an increase of one in the filled jobs estimate from a business survey);
  • if a person who was employed in three part-time jobs (working a total of more than 35 hours per week) resigned from these and assumed one full-time job, this would have no impact on the employment estimates from the Labour Force Survey (however, this would lead to a decrease of two in the filled jobs estimate - the number of part-time filled jobs would decrease by three while the number of full-time filled jobs would increase by one); and
  • if a person employed in two part-time jobs became unemployed, the employment estimate from the Labour Force Survey would decrease by one (however, this would lead to a decrease of two in the filled jobs estimate from a business survey).

The Proportion of Secondary Jobs presents the number of secondary jobs as a proportion of the total number of filled jobs for each industry and the total economy. This measure provides insight into the relative number of secondary jobs in each industry, and enables comparison across industries and with each industry to an economy wide average.

Proportion of Vacant Jobs

The development of the Australian Labour Account has made it possible to produce an important new labour market measure – the Proportion of Vacant Jobs (PVJ).

The PVJ provides a useful labour demand-side view of relative labour demand, at the industry level, presenting the relationship between unmet demand (job vacancies) and met demand (filled jobs) within the Australian Labour Account.

The PVJ is calculated as the number of vacant jobs as a proportion of total jobs. This derived measure is a function of filled jobs and job vacancies. By bringing together met demand and unmet demand, the PVJ provides new insights into changes in the labour market.

In addition to providing insights into cyclical labour demand and employment, changes in the PVJ over time can also highlight that some of the following may be occurring:

  • Changing employment capacity – there may be indications that the industry is nearing its full employment potential or, conversely, that there is the possibility of future employment growth;
  • Job churn – the industry may not be maintaining long term employment, resulting in a high number of job vacancies without long term growth in employment;
  • Skill mismatch – current availability of skills may not be able to satisfy employer requirements, resulting in an extended search for appropriately skilled staff; and/or
  • Changing employment conditions or arrangements - the industry may be transitioning from full-time to part-time roles, or a greater use of contractors or use of labour hire firms.

Understanding changes in the PVJ (and analysing the underlying factors contributing to these changes) will enable Australia to better understand its labour market.

Jobs sources

Source data for quarterly and industry estimates of jobs

Numbers of filled jobs, from the business sources side, are sourced from the following ABS data:

  • Quarterly estimates of private sector jobs are estimated from underlying data from the Quarterly Business Indicators Survey (QBIS), from Business Indicators, Australia.
  • Quarterly estimates of private sector jobs for out of scope ANZSIC Divisions in QBIS are estimated from the Economic Activity Survey (EAS), published in Australian Industry for ANZSIC Division A (Agriculture, Forestry and Fishing) and Division O (Public Administration and Safety), using quarterly Compensation of Employees as a quarterly indicator series; and
  • Quarterly data for the public sector are estimated using underlying data from the Survey of Employment and Earnings (SEE), from Employment and Earnings, Public Sector, using quarterly public sector Compensation of Employees as a quarterly indicator series.

Business survey data are supplemented by ABS business register information, defence force information, child workers information and estimates from the ABS Labour Force Survey for contributing family workers.

The number of filled jobs, from the household survey side, is the aggregate of the number of main jobs and secondary jobs, less jobs with formal job sharing arrangements. Estimates for main jobs and secondary jobs are sourced from underlying data from Labour Force, Australia. Survey based data are supplemented with defence force information, child workers information, information on non-residents working in Australia, and Australian residents living in Australia employed by overseas companies/business entities to account for survey scope restrictions. There is no information currently available on the number of jobs with formal job sharing arrangements.

Numbers of job vacancies are sourced from Job Vacancies, Australia. Data from the Internet Vacancy Index, published by the Department of Employment, Skills, Small and Family Business, are used to supplement ABS survey data for the out of scope ANZSIC Division A (Agriculture, Forestry and Fishing).

The table below summarises data sources used in compiling quarterly and industry estimates of jobs.

Source dataUse in compiling quarterly data
Australian IndustryUsed to benchmark quarterly data from Business Indicators, Australia of Employees as a quarterly indicator series. Also used to compile estimates of private sector filled jobs (business sources) for out of scope ANZSIC Divisions in QBIS, using quarterly Compensation.
Business Indicators, AustraliaUsed to compile quarterly estimates of private sector filled jobs (business sources).
Employment and Earnings, Public SectorUsed to compile estimates of public sector filled jobs (business sources), using quarterly Compensation of Employees as a quarterly indicator series.
Business register information (ABS Business Register Unit)Used for scope adjustments to private sector filled jobs (business sources).
Defence force information (ABS National Accounts)Used to estimate out of scope defence jobs for both filled jobs (business sources) and filled jobs (household sources).
Labour Force, AustraliaUsed to estimate filled jobs (household sources), both main and secondary jobs. Also used to estimate jobs held by out of scope non-residents working in Australia, and unemployment.
Child Employment, Australia, 2006Used to estimate out of scope child employment for both filled jobs (business sources) and filled jobs (household sources).
Migration, Australia and Overseas Arrivals and Departures, AustraliaUsed to estimate jobs held by out of scope non-residents working in Australia.
Balance of PaymentsUsed to estimate out of scope Australian residents living in Australia employed by overseas companies/business entities.
Job Vacancies, AustraliaUsed to compile job vacancies, and total jobs.
Internet Vacancy Index (Department of Employment, Skills, Small and Family Business)Used to compile jobs vacancies, and total jobs, for the out of scope Agriculture, Forestry and Fishing ANZSIC Division A.

Source data for annual estimates of jobs

The number of annual filled jobs, from both the business and household side, and the number of annual job vacancies, are compiled from the same data sources as the quarterly estimates.

Jobs methods

The Jobs quadrant provides data on the number of jobs (filled and vacant) as at the end of the quarter. Job statistics are compiled for each ANZSIC industry subdivision and division, and for the economy as a whole. Unless otherwise stated, the methods described apply to both levels of aggregation.

Total jobs

Total jobs is the sum of filled jobs, plus job vacancies.

Filled jobs

Filled jobs (business sources)

The number of filled jobs, from the business sources side, is equivalent to the number of people employed in enterprises resident in the Australian Economic Territory and engaged in economic activity within the scope of the National Accounts production boundary. People counted include employees, working proprietors and partners, employees absent on paid or prepaid leave, employees on workers' compensation who continue to be paid through the payroll, and contract workers paid through the payroll.

Filled jobs (business sources), for each quarter, is estimated by aggregating:

  • For the private sector, the number of employees as at the end of each quarter, sourced from the annual Economic Activity Survey (EAS) and published in Australian Industry;
  • For the public sector, the number of employees as at the end of each quarter, derived using underlying data from the Survey of Employment and Earnings (SEE). Public sector SEE data used in the Australian Labour Account exclude units in the non-financial and financial sectors, as they are also in scope of the EAS; and
  • Quarterly estimates of underlying Quarterly Business Indicator Survey (QBIS) data from Business Indicators, Australia to represent private sector employment in ANZSIC Division K (Finance and Insurance Services), which is out of scope of the EAS.

These three surveys cover most of the ANZSIC industries, except for:

  • Class 6310 Life Insurance;
  • Class 6330 Superannuation Funds; and
  • Class 7600 Defence.

Units in ANZSIC Class 6330 Superannuation Funds are funds set up to provide retirement benefits. Conceptually they are considered to be non-employing units, and therefore would not contribute to Australian Labour Account estimates. As such, no estimate for employment in this industry has been included.

Scope adjustments are made for the following sectors and populations:

Add:

  • The number of persons employed (at the end of each quarter) in ANZSIC Class 6310 (Life Insurance), sourced from underlying data from the ABS Business Register. This industry is not included in the EAS or QBIS.
  • The number of persons employed in the permanent defence forces as at the end of each quarter, sourced from underlying ABS National Accounts data. Defence force personnel fall outside the scope of the SEE. All defence force personnel in Class 7600 (Defence) are assumed to work in the Public Administration and Safety industry (ANZSIC Division O).
  • The number of unpaid contributing family workers for the quarter, sourced from the Labour Force Survey and published in Labour Force, Australia, as unpaid employees are out of scope of ABS business surveys.
  • An estimate of the number of child workers (persons aged 5 to 14) who are self-employed, working on a farm, or as a contributing family worker. These data are sourced from ABS household survey data, using underlying data from Child Employment, Australia, 2006. Population estimates from Australian Demographic Statistics are used to extrapolate the number of child workers from the 2006 benchmark level, by assuming that the proportion of the age group working has not changed. Industry proportions are based on underlying Labour Force Survey data on employed persons aged 15 years old. No adjustments are made for child workers who are employees, as these persons are in scope of both EAS and QBIS.

Deduct:

  • The number of persons engaged in ANZSIC subdivision 28 Water Supply, Sewerage and Drainage (Employment and Earnings, Public Sector, Australia) as this subdivision is included in the Australian Industry. ABS Business Register data are available from June 2007. For earlier time periods, the movement in filled jobs for the Electricity, Gas, Water and Waste Services industry is applied.
Calculation of filled jobs (business sources) by industry

Data derived from an annual survey are generally considered to be of higher quality than quarterly data due to the larger sample sizes, and are generally subject to less volatility than quarterly run surveys. Annual source data provide overall levels, known as annual benchmarks, from which quarterly estimates are compiled. This ensures consistency between the quarterly and annual labour accounts.

For all ANZSIC industry divisions except A (Agriculture, Forestry and Fishing); K (Financial and Insurance Services) and O (Public Administration and Safety), a mathematical technique (the modified Proportional Denton Method) is used to benchmark quarterly stocks of private sector jobs reported in QBIS to annual data from EAS. This ensures the benchmarked quarterly levels are identical each June quarter, while maintaining the observed quarterly pattern from QBIS as much as possible.

For the most recent quarters, for which EAS year-end data are not available, the previous year-end EAS numbers are extrapolated, also using the modified Proportional Denton Method. Extrapolated data are calculated for up to 6 quarters, due to the 18 month lag in the delivery of EAS data.

For Division A (Agriculture, Forestry and Fishing) and Division O (Public Administration and Safety), for which QBIS data are not available, EAS estimates of the number of jobs is used as an annual benchmark, with quarterly Compensation of Employees used as a quarterly indicator series.

For Division K (Finance and Insurance Services) for which EAS data are not available, employment data reported in QBIS are used directly as the quarterly estimate of private sector job holding.

To calculate the number of public sector filled jobs, underlying data from the Survey of Employment and Earnings (SEE) are used as an annual benchmark, with quarterly public sector Compensation of Employees used as a quarterly indicator series.

EAS data are not available on a consistent industry classification prior to 2009-10. For time periods prior to June 2010, filled jobs as measured from business sources are derived as follows: 

  • From December quarter 2001 to June quarter 2010: seasonally adjusted movements in Compensation of Employees (which have been price deflated using the Wage Price Index), are applied to the June 2010 level.
  • From September quarter 1994 to December quarter 2001, movements in the number of employees from Wage and Salary Earners, Australia are applied to the December 2001 level. These data relate to both the public and private sectors for each industry division except for Division A (Agriculture, Forestry and Fishing), which is limited to the public sector only. Applying movements from the Agriculture industry based on the public sector data produces large movements, given the small level associated with the indicator series. Movements from the Transport and storage industry are instead used as a proxy, given the strong links in production and supply chains between agriculture and transport. As the data are also on a historical industry classification basis, conversion factors based on employees from the Labour Force Survey are applied to approximate the current industry classification.

Filled jobs (household sources)

The number of filled jobs, from the household side, is equal to the number of people employed in main jobs and secondary jobs sourced from the household Labour Force Survey.

Filled jobs (household sources), for each quarter, is estimated by aggregating:

  • The number of main jobs reported in the end of quarter reference month (i.e. March, June, September and December) in the household Labour Force Survey and published in Labour Force Australia, and
  • The number of secondary jobs reported in the end of quarter reference month in the household Labour Force Survey.

The following scope adjustments are made:

Add:

  • The number of persons employed in the permanent defence forces as at the end of each quarter, to the estimate of main jobs. Defence force personnel are not included in the Labour Force Survey, and these data are sourced from underlying ABS National Accounts data. All defence force personnel are assumed to work in ANZSIC Division O (Public Administration and Safety). Permanent defence force personnel are also assumed to work solely in their main job and not have multiple jobs.
  • An estimate of the number of child job holders who are aged between 5 to 14 years as at the end of each quarter, to the estimate of main jobs. It is assumed that child workers do not hold secondary jobs. The estimate covers all child workers, regardless of employment status, as all children less than 15 years of age are excluded from the scope of the Labour Force Survey. The estimate is derived from data collected in the 2006 household survey Child Employment, Australia, 2006. Population estimates from Australian Demographic Statistics have been used to extrapolate the number of child workers from the 2006 benchmark level, by assuming the proportion of children in the 5-14 year age cohort who work has remained the same as that recorded in 2006. Industry allocations are based on underlying Labour Force Survey data on the industry of employment of 15 year old persons.
  • An estimate of the number of main jobs held by non-resident visitors to Australia employed by Australian resident enterprises to the estimate of main jobs (see Non-resident visitors section below).
  • An estimate of the number of secondary jobs held by non-resident visitors employed by Australian resident enterprises to the number of secondary jobs.

Non-resident visitors

Time periods from March 2006 onwards

The Labour Force Survey excludes from its scope non-resident visitors who intend spending less than 12 months in Australia, some of whom are employed during their stay by Australian resident enterprises. As non-resident visitors are included in the scope of business surveys (EAS and QBIS), only household side labour force data are adjusted to include non-resident visitors who are employed.

Data are sourced from short term visitor arrivals statistics from Overseas Arrivals and Departures, Australia and overseas migration data from Overseas migration. Data are obtained for the number of short term visitors who are present in Australia at the end of the reference quarter but who are not included in the Estimated Resident Population. Of interest are those people who have entered the country with a visa that includes working rights. Information on the main reason for journey is also collected. These visa classes and reasons for journey are detailed below.

Visa subclasses and Reasons for journey used in the Australian Labour Account

Visa subclass

400 Temporary Work (Short Stay Activity) (from 23/3/13)
401 Temporary Work (Long Stay Activity) (from 24/11/12)
402 Training and Research (from 24/11/12)
403 Temporary Work (International Relations) (from 24/11/12)
405 Investor Retirement (from 1/11/04)
410 Retirement
416 Special Program
417 Working Holiday
419 Visiting Academic
420 Entertainment
421 Sport
422 Medical Practitioner
423 Media and Film Staff
424 Public Lecturer
426 Diplomatic or Consular
427 Domestic Worker Overseas Executive
428 Religious Worker
430 Supported Dependent of Australian or NZ Citizen Temp in Australia
442 Occupational Trainee
444 Special Category - New Zealand Citizen
456 Business (Short Stay) (from 1/8/96)
457 Temporary Work (Skilled) (from 24/11/12) previously Business (Long Stay) (from 1/8/96)
459 Sponsored Business Visitor (short stay) (from 1/7/00)
461 New Zealand Citizen (Family Relationship) Temporary Visa (from 26/2/01)
462 Work and Holiday
470 Professional Development (from 1/7/03)
476 Skilled - Graduate (from 1/9/07)
482 Temporary Skill Shortage (from 18/03/2018)
485 Temporary Graduate (from 23/3/13) previously Skilled - Graduate (from 1/9/07) (replaced 497)
500 Student (Temporary) (from 01/07/16)
570 Independent ELICOS Sector(from 1/7/01)
571 Schools Sector (from 1/7/01)
572 Vocational Education and Training Sector (from 1/7/01)
573 Higher Education Sector (from 1/7/01)
574 Postgraduate Research Sector (from 1/7/01)
575 Non-Award Foundation/Other Sector (from 1/7/01)
576 Ausaid/Defence Sponsored Sector (from 1/7/01)
995 Diplomatic

Reason for journey 

  • Business
  • Convention/conference
  • Education
  • Employment
  • Exhibition – Other/Not Stated/Not Applicable
  • Holiday
  • Visiting friends and relatives
Visa subclass and reason for journey - used in calculating short term visitor arrivals

400 Employment
401 Employment; Education
402 Employment; Education
403 Employment; Education
405 Employment; Education
410 Employment; Education
416Employment; Education
417 Employment; Education; Holiday; Business; Visiting friends and relatives
419 Employment; Education
420 Employment; Education
421 Employment; Education
422 Employment; Education
423 Employment; Education
424 Employment; Education
426 Employment; Education
427 Employment; Education
428 Employment; Education
430 Employment; Education
442 Employment; Education
444 Employment; Education
456 Employment; Education
457 Employment; Education; Business; Visiting friends and relatives
459 Employment; Education
461 Employment; Education
462 Employment; Education; Holiday
470 Employment; Education
476 Employment; Education
482 Employment; Education; Business; Visiting friends and relatives
485 Employment; Education
500 Employment; Education
570 Employment; Education
571 Employment; Education
572 Employment; Education
573 Employment; Education
574 Employment; Education
575 Employment; Education
576 Employment; Education
995 Employment; Education


Visa classes are aggregated into three main groups: short term visitors (students); short term visitors (sponsored visa holders); and short term visitors (other).

To estimate the number of main jobs held by students who short term visitors, the quarterly average employment rate of resident persons attending tertiary education, obtained from the Labour Force Survey, is multiplied by the estimated number of short term student visa holders. The Labour Force Survey data used in the calculation of employed short term students is limited to those persons aged 15-24 years old, who are currently undertaking full-time tertiary education. The method assumes that similar employment rates apply to short term visitors on student visas as for full-time Australian resident tertiary students, and that all short term student visa holders are in the labour force (either employed or unemployed).

To estimate the number of main jobs held by other short term visitors, the quarterly average employment rate for all residents is multiplied by the number of visa holders (other than sponsored visa holders) with working rights. This method assumes that all temporary entrants with a visa that had working rights (other than 400, 457 and 482 visa holders) were in the labour force (either employed or unemployed), and that similar rates of employment for this group apply when compared with the resident population

To estimate the number of main jobs held by short term visitors who are sponsored visa holders, the total number of short term arrivals with this type of visa is used. As these visa types require that the holder remains employed for the duration of the visa, an employment rate of 100% is assumed.

To estimate the number of secondary jobs held by other non-resident short-term visitors, the estimated number of non-resident main job holders (excluding students and sponsored visa holders) is multiplied by the proportion of resident employed persons who hold multiple jobs sourced from the Labour Force Survey. Students and sponsored visa holders are assumed to only hold main jobs, due to the restrictions associated with these types of visa. This method assumes that the same proportion of short term visitors hold multiple jobs as for the resident employed population.

There is a time lag in the estimation of Net Overseas Migration (NOM) data. Consequently, estimates of short term visitors for the latest quarters are extrapolated by applying movements in Overseas Arrivals and Departures (OAD) data to estimates of NOM. The movements are applied after matching visa codes and reasons for journey between the NOM and OAD series.

Time periods from September 1994 to December 2005 

OAD and NOM data with both visa type and reason for journey are not available for the entire time series of the Australian Labour Account. For earlier time periods, the following data are available:

  • NOM data classified by reason for journey by visa type is available from March 2006
  • OAD data classified by reason for journey by visa type is available from September 2004
  • OAD data classified by reason for journey only is available from September 1993.

As with the current end of the NOM series, estimates for the periods prior to March 2006 are modelled from OAD data by applying movements with matching visa codes and reasons for journey category to the estimates of March 2006.

The resulting series are aggregated to students, non-students and sponsored visa holders in the same way as for the rest of the time series.

Disaggregation to industry

Jobs held by short term visitors are disaggregated to industry in the following ways:

  • Main jobs held by short term visitors (students) are disaggregated to industry using an underlying Labour Force Survey series of persons aged 15-24 attending full-time educational institutions.
  • For main jobs held by other short term visitors, underlying data from Labour Force Survey supplementary surveys which approximates tenuous employment, namely part-time employment with no leave entitlements, are used.
  • For main jobs held by short term visitors (sponsored visa holders), data from the Department of Home Affairs on the industry of the employer sponsoring the visa are used to distribute the total to industry division. Division level totals are further disaggregated to subdivision, using the tenuous employment data described above. Data from the Department of Home Affairs are not available prior to the 2005-06 financial year. For time periods prior to this, 2005-06 industry proportions are assumed to apply. 
  • Data for short term visitors on “working holiday visas” (417 and 462) is distributed to industry using published information on employers of these visa types from the Australian Taxation Office.
  • For secondary jobs held by sponsored visa holders) is assumed to apply. 

Deduct:

  • the number of jobs held by Australian residents living in Australia employed by non-resident enterprises, sourced from underlying Balance of Payments data. As most of the people involved are employed by agencies of foreign governments (consulates, embassies etc.), the deductions are made from ANZSIC subdivision 75 (Public Administration) within Division O (Public Administration and Safety). Although the Labour Force Survey would include people over the age of 15 years in this category, they are not contributing to economic activity within Australian economic territory as measured in the Australian National Accounts.
Calculation of filled jobs (household sources) by industry

The Labour Force Survey collects quarterly data on the industry of the main job held by employed persons. For each employed person, it also collects the number of secondary jobs held (second, third, fourth or more). The Labour Force Survey does not record the industry of secondary jobs. To calculate the number of filled jobs and people employed at an industry level requires the allocation of each secondary job to an industry.

This is done in the Australian Labour Account by first obtaining the total number of multiple job holders and the number of second, third and fourth jobs from the Labour Force Survey. Employed persons who indicate they hold more than four jobs are assumed to hold only four jobs, as no further information on the number of jobs actually held is available. At this stage of compilation, multiple job holders and second, third and fourth jobs are classified by the industry of main job for each employed person.

Data from the ABS Linked Employer Employee Dataset (LEED) are then used to determine the proportions of the industry of employment of second, third and fourth jobs for multiple job holders, and applied to industry of main job Labour Force Survey data. These proportions are extracted as at the end date for each quarter from the LEED, and are updated as new data points become available. Industry proportions from the earliest available LEED are applied to earlier time periods in the Australian Labour Account, and similarly the latest available proportions are applied to subsequent time periods where necessary.

Where relevant, data are sourced from information collected in the Labour Force Survey in the last month of the relevant quarter, and apportioned across the industries using the related quarterly labour force industry data. For example, estimates in the September quarter Australian Labour Account are sourced from September month Labour Force data, which are then distributed across industry divisions from the industry distribution of quarterly data captured in the August Labour Force Survey published in Labour Force, Australia, Detailed, Quarterly.

Sector of Filled Jobs

One commonly used sector classification in labour statistics is the public and private sector classification. In this classification, the public sector includes all government units, such as government departments, non-market non-profit institutions that are controlled and mainly financed by government, and corporations and quasi-corporations that are controlled by government. The private sector refers to enterprises that are not controlled by Commonwealth, state/territory or local governments (that is, any enterprise that is not part of the public sector).

The Australian Labour Account publishes estimates of private and public sector filled jobs. These are compiled by applying proportions from business sources (with data from the Economic Activity Survey representing the private sector, and data from the Survey of Employment and Earnings representing the public sector) to balanced numbers of filled jobs for each industry.

Job sharing

There is currently no household side information available on the number of jobs with job sharing arrangements. As a result, the total number of filled jobs is equivalent to the sum of reported main jobs and secondary jobs, plus scope adjustments. As with the business side, shared jobs on the household side would be counted as many times as there are people engaged in such arrangements.

Annual jobs methods

The Jobs quadrant contains stock data, which are data that measure certain attributes at a point in time. To determine an annual estimate of jobs in this quadrant, an average level is derived using a simple arithmetic average of the four quarterly estimates. Refer to Labour Account Methods for an example of this method.

The annual estimate of jobs is an approximate estimate of the number of jobs at any point in time during the year.

Job vacancies

A job vacancy is a job available for immediate filling on the survey reference date and for which recruitment action has been taken. Recruitment action includes efforts to fill vacancies by advertising, by on site or online notices, by notifying employment agencies or trade unions and by contacting, interviewing or selecting applicants already registered with the enterprise or organisation.

Estimates of job vacancies exclude:

  • jobs not available for immediate filling on the survey reference date;
  • jobs for which no recruitment action has been taken;
  • jobs which became vacant on the survey date and were filled on the same day;
  • jobs of less than one day's duration;
  • jobs only available to be filled by internal applicants within an organisation;
  • jobs to be filled by employees returning from paid or unpaid leave or after industrial disputes;
  • vacancies for work to be carried out by contractors; and
  • jobs for which a person has been appointed but has not yet commenced duty.


Total quarterly job vacancies are calculated as:

  • the sum of the number of vacant positions reported in the ABS Job Vacancies Survey for the relevant quarterly reference date/month (3rd Friday of February, May, August and November) and published in Job Vacancies, Australia (ABS cat. no. 6354.0); plus
  • the number of job advertisements from the Department of Employment, Skills, Small and Family Business Internet Vacancy Index (as at the 1st day of the third month of the reference quarter; i.e. 1 March, 1 June, 1 September, 1 December), for the following Australian and New Zealand Standard Classification of Occupations (ANZSCO) occupation codes: 12 Farmers and Managers; 36 Skilled Animal and Horticultural Workers; and 84 Farm, Forestry and Garden Workers.

Internet Vacancy Index data are added to capture vacancies available in employing enterprises primarily engaged in Agriculture, Forestry and Fishing, which are out of scope of the quarterly ABS Job Vacancies Survey.

Industry detail at the ANZSIC subdivision level is not available directly from either the ABS Job Vacancies Survey or the Department of Employment, Skills, Small and Family Business Internet Vacancy Index, and is modelled in the Australian Labour Account using the following methods:

  • For subdivisions within Division A (Agriculture, Forestry and Fishing), information from the Department of Employment, Skills, Small and Family Business Internet Vacancy Index for agricultural occupations at four digit ANZSCO level are aggregated to approximate these ANZSIC subdivisions; and
  • For all remaining subdivisions, ANZSIC division level information from the Job Vacancies Survey is disaggregated to subdivision level using data from the Labour Force Survey relating to employees by subdivision (excluding Owner Managers of Unincorporated Enterprises).

Data from the ABS Job Vacancies Survey are available on the current ANZSIC 2006 industry classification from November 2009 onwards, and data on an ANZSIC 1993 basis and the total number of job vacancies are available for earlier time periods. Data for each ANZSIC 2006 industry division for earlier time periods are estimated by applying a concordance between the ANZSIC 1993 and ANZSIC 2006 industry classifications. The known total number of job vacancies is maintained using this approach. Data at the industry division level are then distributed to industry subdivision by applying proportions from the LFS employees (excluding Owner Managers of Unincorporated Enterprises) series.

The Job Vacancies Survey was suspended for five periods between August 2008 and August 2009 inclusive, as a result of a series of cuts to the ABS forward work program. The ABS has used econometric modelling techniques using a full-time equivalent flow series to estimate total job vacancies for the missing period. It should be noted that the modelled data are not part of the Job Vacancies Survey series and are not available in the related publication or the Australian Labour Account. However, modelled data for the gap period have been used in the production of seasonally adjusted and trend time series data.

Job vacancies for each industry for the period September 2008 and September 2009 have been estimated by applying the movement from the LFS number of employees (excluding Owner Managers of Unincorporated Enterprises) to subdivision level job vacancies data on an ANZSIC 2006 basis from December 2009. These industry estimates are constrained to the modelled total number of job vacancies for this period.

Data from the Department of Employment, Skills, Small and Family Business are available from January 2006 onwards. Data for earlier time periods are estimated by applying the movement in the number of employees (excluding Owner Managers of Unincorporated Enterprises) for each Agriculture subdivision from the LFS to the 2006 level.

Jobs quadrant calculations

Jobs quadrant sources and calculations

Jobs quadrant sources and calculations
The diagram shows that: Job Vacancy Survey (ABS) data plus Internet Vacancy Index (DoE) data - Div A equals Total job vacancies QBIS data (Div K) plus EAS data (Div A and O with COE as quarterly indicator series) plus QBIS data (for remaining Divs, benchmarked to annual EAS data) equals Total filled jobs (business sources), private sector SEE data (with COE as quarterly indicator series) plus Total filled jobs (busines sources) private sector equals Total filled jobs (business sources) Industry scope adjustments (ABS) plus Defence personnel (NAB) plus Contributing family workers (LFS) plus Child workers (not working for an employer) equals Adjustments to filled jobs (business sources) Total filled jobs (business sources) plus Adjustments to filled jobs (business sources) equals Labour Account filled jobs (business sources) Labour Account filled jobs (business sources) plus Total job vacancies equals Labour Account total jobs (business sources) Labour Force Survey (LFS) main jobs (monthly) multiplied by Labour Force Survey (LFS) main jobs (quarterly industry proportions) equals Labour Account Labour Force Survey main jobs Labour Force Survey (LFS) secondary jobs (monthly) multiplied by secondary jobs proportions (LEED) equals Labour Account Labour Force Survey secondary jobs Defence personnel (NAB) plus Non residents employed in Australia adjustment (ABS) plus Child workers (all employed children) less Residents employed overseas adjustment (BoP) equals Adjustments to filled jobs (household surveys) Labour Account Labour Force Survey main jobs plus Labour Account Labour Force Survey secondary jobs plus Adjustments to filled jobs (household surveys) equals Labour Account filled jobs (household surveys) Labour Account filled jobs (business sources) less Labour Account filled jobs (household sources) equals Statistical discrepancy (jobs)

Persons quadrant

The Persons quadrant provides statistics on employed people, people looking for and available for employment (unemployed people), and underemployed people.

Persons quadrant

Persons quadrant
The diagram shows that: Employed persons equals Number of main jobs (Total economy level). Unemployed persons plus Underemployed persons equals Underutilised persons. Employed persons plus Unemployed persons equals Labour Force.

Persons concepts

The official measure of the population of Australia is based on the concept of usual residence. It refers to all people, regardless of nationality, citizenship or legal status, who usually live in Australia, with the exception of foreign diplomatic personnel and their families.

The Australian Labour Account uses a practical application of the ‘12/16’ rule to establish usual resident status for non-resident visa holders with working rights. A person is regarded as a usual resident if they have been (or expect to be) residing in Australia for a period of 12 months or more. This 12 month period does not have to be continuous and is measured over a 16 month period. For more information on the ‘12/16 month rule’ methodology, see the Technical Note in Migration, Australia, 2008-09.

The scope of the population in the Australian Labour Account includes all persons who contribute to Australian economic activity, irrespective of age.

Persons sources

Source data for quarterly and industry estimates of persons

Labour statistics represented in the Persons quadrant are mostly sourced from estimates calculated from the monthly Labour Force Survey. Data from the monthly Labour Force Survey are released in two stages: Labour Force, Australia, and Labour Force, Australia, Detailed. Labour Force Survey data are supplemented with defence force information, child workers information and information on non-residents. 

Data from the ABS Linked Employer Employee Dataset (LEED) are used to determine industry of employment of secondary job holders, and applied to Labour Force Survey data to calculate total jobs in each industry. This information is used to adjust the Labour Force Survey estimate of employed persons in each industry, by excluding multiple job holding within the same industry from the total number of filled jobs.

The table below summarises data sources used in compiling quarterly and industry estimates of persons.

Source dataUse in compiling quarterly data
Labour Force, Australia and Labour Force, Australia, DetailedUsed to compile estimates of employed persons, unemployed persons, underemployed persons, not in the labour force and civilian population
Defence force information (National Accounts)Used to estimate employed defence personnel.
Child Employment, Australia, 2006Used to estimate employed children.
Migration, Australia and Overseas Arrivals and Departures, AustraliaUsed to estimate short-term non-residents working in Australia.
Balance of PaymentsUsed to estimate employed Australian residents living in Australia employed by overseas companies/business entities.
Australian Demographic StatisticsUsed for the total estimated resident population.

Source data for annual estimates of persons

The same source data are used in compiling annual estimates in the Persons quadrant.

Persons methods

The Persons quadrant provides data on the number of employed, unemployed and underemployed persons for each quarter. Persons statistics are compiled for all industries (at both the division and subdivision level) and for the economy as a whole. Unless otherwise stated, the methods described apply to both levels of aggregation.

Labour Account employed persons

Similar adjustments to those made in compiling the Jobs quadrant are made to adjust the employed persons estimate from the Labour Force Survey to align with 2008 SNA production and residence concepts. These include calculating estimates for:

  • permanent defence force personnel;
  • employed persons under 15 years of age (child workers);
  • non-residents employed in Australia by Australian businesses; and
  • Australian residents employed working overseas.

At an industry level, similar assumptions are made with respect to multiple job holding for these groups as for employed persons generally, with the exception of the following groups:

  • permanent defence forces, whose employment conditions are presumed to exclude secondary jobs;
  • short term arrival students and sponsored visa holders are assumed to only hold main jobs, due to the restrictions associated with these types of visa; and
  • employed children under 15 years, who are also assumed to not hold secondary jobs.

Please refer to the Jobs Quadrant Methods for more detail regarding these adjustments.

Similar to the Jobs quadrant, the Persons quadrant, where relevant, uses data sourced from information collected in the Labour Force Survey in the last month of the relevant quarter, and apportions this across the industries using the related quarterly labour force industry data. For example, estimates in the September quarter labour account are sourced from September month Labour Force data, which are then distributed across industry divisions from the industry distribution of quarterly data captured in the August Labour Force Survey published in Labour Force, Australia, Detailed.

Calculation of employed persons by industry

At an industry level, the number of employed persons is the sum of those holding main jobs in the industry, plus those holding secondary jobs after adjusting for double counting (i.e. for persons holding multiple jobs in the same industry). The Labour Force Survey captures data quarterly on the industry of the main job held by employed persons. For each employed person, it also records the number of secondary jobs held (second, third, fourth or more). The Labour Force Survey does not record the industry of secondary jobs.

Data from the ABS Linked Employer Employee Dataset (LEED) are then used to determine the proportions of the industry of employment of second, third and fourth jobs for multiple job holders, and applied to industry of main job Labour Force Survey data. These proportions are used to allocate the relevant quarterly Labour Force Survey secondary job holdings to each industry, to estimate the total number of filled jobs in each industry.

These proportions are extracted as at the end date for each quarter from the LEED, and are updated as new data points become available. Industry proportions from the earliest available LEED are applied to earlier time periods in the Australian Labour Account, and similarly the latest available proportions are applied to subsequent time periods where necessary.

To estimate the number of people employed in each industry, instances where the industry of second job is the same as the industry of main job are identified. These jobs are removed to derive a count of the number of additional people employed in each industry, and added to LFS main job data. 

The Labour Force Survey provides an estimate of employed persons in each industry of main job. The Australian Labour Account produces the total number of people employed in each industry from an industry perspective. As a result, the sum of employed persons in the Australian Labour Account across industry divisions does not equal the total number of people employed in the whole economy. 

The purpose of adjusting the Labour Force Survey number of people employed in each industry of main job is to provide information on the total number of people employed in each industry in a time series. This could be used to assess training programs or policy changes targeting a particular industry, to provide a more realistic picture of the number of people who may be impacted by any such change. 

Multiple Job Holders 

The Labour Force Survey identifies multiple job holders as employed persons who, during the reference week, worked in more than one job and that was not the result of changing jobs. Multiple job holding is the main reason why estimates of employment from the Labour Force Survey cannot be equated to estimates of jobs. Also, under the Labour Force Survey, industry classification for multiple job holders is based on main job, with this main industry identified using hours actually worked.

In the Linked Employer Employee Dataset (LEED), multiple job holders are persons who have two or more concurrent jobs at any point during the financial year. Industry information is available for each individual job.

The Australian Labour Account incorporates both Labour Force Survey and LEED data, and can use this information to provide data on the number of multiple job holders. This is distinct from the number of secondary jobs for each industry, which is presented in the Jobs quadrant.

Estimates of multiple job holders in the Australian Labour Account are compiled by applying proportions from business/ administrative data sources (the LEED) to balanced numbers of main jobs for each industry, while controlling to the proportion of multiple job holding at the total economy level taken from the Labour Force Survey. 

Additional estimates of persons

The Persons quadrant includes additional related estimates at both total economy and industry levels for:

  • Unemployed Persons;
  • Underemployed Persons;
  • Underutilised Persons; and
  • Persons not in the Labour Force (total economy only).

It should be noted that industry estimates for the unemployed population are based on industry of last job worked (within the past two years) from the Labour Force Survey, and do not necessarily equate to the industries in which the unemployed are currently seeking work, nor do they include those who have never held a job previously. As such, care should be exercised when interpreting estimates of unemployed persons (and therefore underutilised persons and the total labour force) on an industry basis.

Annual estimates of persons

The Persons quadrant contains stock data, which are data that measure certain attributes at a point in time. To determine an annual estimate of persons in this quadrant, an average level is derived using a simple arithmetic average of the four quarterly estimates. Refer to Labour Account Methods for an example of this method.

The annual estimate of employed persons is an approximate estimate of the number of persons employed at any point in time during the year.

Persons quadrant calculations

Persons quadrant sources and calculations

Persons quadrant sources and calculations
The diagram shows that: Labour Force Survey (LFS) main jobs by status in employment (monthly) multiplied by Labour Force Survey (LFS) main jobs by status in employment (quarterly industry proportions) equals Labour Force Survey employed persons by industry by quarter. Defence personnel (NAB) plus Non residents employed in Australia adjustment (ABS) plus Child workers (all employed children) plus Secondary employment (Jobs quadrant) less Residents employed overseas adjustment (BoP) equals Adjustments to employed persons. Labour Force Survey (LFS) employed persons by industry by quarter plus Adjustments to employed persons equals Labour Account employed persons by industry by quarter. Labour Force Survey (LFS) unemployed (monthly) multiplied by Labour Force Survey (LFS) unemployed by industry of last job (quarterly industry proportions) equals Labour Force Survey unemployed persons by industry of last job by quarter. Labour Force Survey (LFS) Underemployed (monthly) multiplied by Labour Force Survey (LFS) underemployed by industry of main job (quarterly industry proportions) equals Labour Force Survey underemployed persons by industry of main job by quarter. Labour Force Survey unemployed persons by industry of last job by quarter plus Labour Force Survey underemployed persons by industry of main job by quarter equals Labour Force Survey underutilised persons by industry by quarter. Labour Force Survey unemployed persons by industry of last job by quarter plus Labour Account employed persons by industry by quarter equals Labour Account Labour Force total by industry by quarter.

Hours quadrant

The Hours (Labour Volume) quadrant describes the relationship between the hours of labour that are supplied by individuals, and the hours of labour that are used or demanded by businesses. These data have a direct link to Australian National Accounts and productivity statistics.

Hours quadrant

Hours quadrant
The diagram shows that: Hours actually worked plus Hours sought but not worked equals Available hours of labour supply. Hours paid for equals Ordinary time hours paid for plus Overtime hours paid for. Hours sought but not worked equals Hours sought by unemployed plus Additional hours sought by underemployed. Hours actually worked divided by Filled jobs equals Average hours worked per job.

Hours concepts

Labour volume is expressed as hours worked, and has been defined in International Labour Organisation (ILO) conventions in terms of the time when (paid) employees were at the disposal of an employer; that is, when available to receive work orders from an employer or person in authority, with hours worked covering all jobs. During such periods of availability, workers are expected to be ready to work if work is possible, requested or necessary. This general concept is made meaningful for the self-employed if it is taken to mean time when the self-employed are available to do their work, such as being at the disposal of clients, ready to receive purchase orders or available to make sales, etc. Further information is available in the ILO Resolution concerning the measurement of working time (Eighteenth International Conference of Labour Statisticians, 2008).

Measuring the levels and trends of hours worked for different groups of employed persons is important in order to monitor working and living conditions, as well as analysing economic cycles. Information on hours of work enables various analytical insights such as: classification of employed persons into full-time and part-time status; the identification of underemployed persons; and the creation of aggregate monthly hours worked estimates. The general notion of hours of work encompasses a number of related concepts: hours usually worked; hours actually worked; hours paid for; and normal hours of work. 

Usual hours worked and actual hours worked

Usual hours worked and actual hours worked
The diagram shows that Usual hours worked less Holidays, sick leave, rostered time off etc. plus Overtime, extra shifts etc. equals Actual hours worked.

Hours usually worked

Hours usually worked is the typical number of hours worked in a job for a short reference period (such as one week) that is representative of a longer reference period (e.g. a month, quarter, season or year). Usual hours may differ from actual hours worked at a given time if employed persons are away from work due to illness, vacation, strike, a change of job or other reasons, or are at work for more hours than normal due to overtime, extra shifts and so on (ILO, Surveys of Economically Active Population, Ch.5).

Hours actually worked

International resolutions relating to actual hours worked adopted by the Eighteenth International Conference of Labour Statisticians (ICLS) in 2008 refer to wage and salaried employees. There are no international recommendations relating to actual hours worked for all categories of the employed population. However the ILO, in its manual Surveys of Economically Active Population, Employment, Unemployment and Underemployment, suggests that actual hours worked in a given job should be defined to cover all types of employment in labour force surveys. Hours actually worked is the time spent in a job for the performance of activities that contribute to the production of goods and services during a specified short or long reference period.

According to the ILO resolution, actual hours of work measured within the 2008 SNA production boundary includes all time spent directly on, and in relation to, productive activities; down time; and resting time such as: 

  • time spent in addition to hours worked during normal periods of work (including overtime);
  • time spent at the place of work on activities such as the preparation of the workplace, repairs and maintenance, preparation and cleaning of tools, and the preparation of receipts, time sheets and reports;
  • time spent at the place of work waiting or standing by due to machinery or process breakdown, accident, lack of supplies or power or internet access, etc.; and
  • time corresponding to short rest periods (resting time) including tea and coffee breaks or prayer breaks.

Excluded are:

  • hours paid for but not worked such as paid annual leave, public holidays or paid sick leave;
  • meal breaks; and
  • in respect of paid employment, time spent on travel to and from work when no productive activity for the job is performed (even when paid by the employer).

Monthly hours worked in all jobs

Monthly hours worked in all jobs is a measure of the total number of hours worked by employed persons in a calendar month. Monthly hours worked in all jobs are modelled estimates.

Seasonally adjusted monthly hours worked in all jobs estimates are produced by combining two series.

The first series is the seasonally adjusted actual hours worked in the reference week, adjusted for holiday timing. These estimates provide an indication of movements across months. 

The second series is an annual benchmark series containing original estimates of actual hours worked in each financial year. The annual actual hours worked original estimates are calculated by determining the actual hours worked for each week of the financial year. As actual hours worked are only collected in respect of the reference week of the Labour Force Survey, actual hours worked for weeks not covered by the Labour Force Survey are imputed based on the actual hours worked for the adjacent reference weeks. The imputation accounts for, amongst other things, the effect of public holidays on hours worked; that is, it accounts for holidays that occur in the reference week of the Labour Force Survey as well as holidays that occur in weeks other than the reference week. 

These two series are then combined to produce the seasonally adjusted monthly hours worked in all jobs series. A trend series is also subsequently produced. This approach ensures that: 

  • The level of the monthly hours worked in all jobs (seasonally adjusted) series is consistent with the level of the annual benchmarks; and
  • The movements in the series are consistent with the movements in the seasonally adjusted actual hours worked in the reference week series.

Estimates of monthly hours worked in all jobs are available from the Labour Force Survey. For more information on monthly hours worked in all jobs, refer to Information Paper: Expansion of Hours Worked Estimates from the Labour Force Survey.

Actual and aggregate hours worked

Actual and aggregate hours worked
The diagram shows that the Aggregate number of actual hours worked are scaled from the reference week to the calendar month, and adjusted to account for trading days, holidays and seasonality to give Aggregate monthyl hours worked.

Hours paid for

Hours paid for applies to a paid-employment job and to a self-employment job paid on the basis of time units. For a paid-employment job, hours paid for is the time for which payment has been received from the employer (at normal rates, in cash or in kind) during a specified short or long reference period, regardless of whether the hours were actually worked or not.

Hours paid for:

  • includes time paid but not worked such as paid annual leave, paid public holidays and certain absences such as paid sick leave; and
  • excludes time worked but not paid by the employer, such as unpaid overtime, and absences that are not paid by the employer, such as unpaid educational leave or maternity leave that is paid through transfers by government from social security systems.

As such, hours paid for will differ from the number of hours actually worked if an employee works more or less hours than their paid hours. Hours paid for will also differ from usual hours in some cases, for example if an employee performs long hours in some weeks to have rostered days or weeks off.

Measures of hours paid for are collected from business payroll records in the ABS Survey of Employee Earnings and Hours (EEH). The EEH also collects information on the following components:

  • ordinary time hours paid for - defined as the award, standard or agreed hours of work paid for at the ordinary rate. Ordinary hours paid for include: stand-by or reporting time hours, which are part of standard hours of work, and hours of paid annual leave, paid sick leave and long service leave taken during the reference period (ASNA, 23.167). Ordinary time hours paid for at penalty rates (e.g. for shift work) are not converted to their ordinary time equivalent; and
  • overtime hours paid for - defined as hours paid for in excess of award, standard or agreed hours of work, at both standard and penalty rates.

Applying the concept in practice, the Australian Labour Account makes no estimate for hours paid and not worked, or hours worked but not paid for, as this is currently a known data gap.

Actual hours worked and hours paid for

Actual hours worked and hours paid for
The diagram shows that Actual hours worked less unpaid overtime and extra shifts and including Paid overtime and extra shifts, plus paid holidays, sick leave etc. equals Hours paid for.

Normal hours of work

Normal hours of work is defined in a 2008 ICLS resolution as ‘the hours fixed by or in pursuance of laws or regulations, collective agreements or arbitral awards to be performed in specified paid-employment jobs over a specified reference period, such as per day, week, month or year (within the 2008 SNA production boundary). Normal hours of work may also apply to a job in self-employment when the hours are in accordance with the hours fixed for all jobs in a specific industry or occupation (such as for drivers to ensure public safety)’ (ICLS 2008, 13(1)).

Measures of normal hours of work are not produced by the ABS. However, the concept is used to assist in allocating respondents in the full-time/part-time status classification in ABS business surveys.

Hours sources

Source data for quarterly and industry estimates of labour volume

All statistics used to populate the Labour Volume quadrant are derived based on calculations involving the average weekly hours paid for rate sourced from underlying data from the publication Employee Earnings and Hours, Australia. The Survey of Employee Earnings and Hours (EEH) is conducted every two years.

No adjustments have been made to the average weekly hours paid for rate, as the necessary adjustments to correct for survey data scope limitations are included in the filled jobs estimate used in the calculations to derive hours paid for estimates. See the Jobs section for an explanation of the scope adjustments made to filled jobs estimates.

The number of hours actually worked, on the household side, is sourced from underlying data from Labour Force, Australia. The Australian National Accounts uses the same underlying source data to derive a quarterly hours actually worked estimate, while also including an estimate for hours worked by defence force personnel. The same adjustment for defence hours is used in the Australian Labour Account, ensuring consistency across both accounts, as well as creating a direct link to the labour productivity statistics published in the Australian System of National Accounts.

For the Australian Labour Account, the hours actually worked data are further adjusted for the number of hours worked by child workers, non-residents living in Australia employed by Australian companies, and Australian residents living in Australia employed by overseas companies.

The number of hours sought by unemployed persons is sourced from Labour Force, Australia, Detailed from 2014 onwards. For earlier periods, a derived average number of hours sought per unemployed person is applied to the relevant number of unemployed people. A similar methodology is applied to derive the number of additional hours sought by underemployed persons.

The table below summarises data sources used in compiling quarterly estimates in the hours quadrant.

Source dataUse in compiling quarterly data
Employee Earnings and Hours, AustraliaUsed in compiling estimates of hours paid for.
Labour Force, AustraliaUsed in compiling estimates of hours actually worked.
Hours worked by defence personnel (Australian National Accounts)Used in compiling estimates of hours actually worked.
Labour Force, Australia, DetailedUsed in compiling estimates of hours sought by unemployed persons, and additional hours sought by underemployed persons.
Child Employment, Australia, 2006Used to estimate the number of hours worked by employed children.
Migration, Australia and Overseas Arrivals and Departures, AustraliaUsed to estimate hours worked by out of scope non-residents working in Australia.
Balance of PaymentsUsed to estimate hours worked by out of scope Australian residents living in Australia employed by overseas companies/business entities.

Source data for annual estimates of labour volume

Source data for the annual estimates of labour volume are the same as those described above for quarterly estimates.

Hours methods

Methods for the compilation of quarterly estimates of labour volume

Hours actually worked

Hours actually worked are collected in the Labour Force Survey. Respondents report the hours worked in their main job and the hours worked in all their jobs in the survey reference week. The aggregate number of hours worked by all employed persons in all jobs (including secondary employment) and main jobs, classified by industry of main job, is calculated for the reference week.

Hours actually worked during the reference week are used to derive modelled estimates of total hours worked by industry of main job across a quarter. The results are published in Labour Force, Australia, and are combined with an estimate of hours worked by permanent defence personnel in the hours actually worked series published in quarterly Australian National Accounts data.

In the hours worked series published in Labour Force, Australia and quarterly Australian National Accounts data, hours worked are allocated to industry on the basis of an employed persons industry of main job. The Australian Labour Account, while maintaining consistency with the total number of hours worked published in Labour Force, Australia, reallocates hours worked among industries to account for instances of secondary job holding.

Permanent defence force personnel hours are sourced from quarterly Australian National Accounts data and are allocated to Australian and New Zealand Standard Industrial Classification (ANZSIC) subdivision 76 (Defence) within Public Administration and Safety (Division O), as conditions of employment assume that secondary jobs are not allowed.

There is no single source of information to determine the industry allocation of hours worked in secondary jobs. Estimates of hours worked in secondary jobs by industry of secondary job are determined by combining information form the Labour Force Survey (LFS), and the Linked Employer-Employee Dataset (LEED). The method used is detailed below:

Step 1: The aggregate hours worked estimates from the LFS are apportioned between hours worked in main jobs and hours worked in secondary jobs, based on LFS estimates of hours actually worked in the reference week of the mid-quarter month. The calculations are performed by industry subdivision of main job, so produce final estimates of hours worked in main job. However, the industry classification of hours worked in secondary jobs is still determined by the industry of main job.

Step 2: The industry classification of those hours worked in secondary jobs is then rederived by the industry of secondary job according to the following process:

  • Take the total hours worked in secondary jobs from step 1. As noted, these series are available by industry of main job.
  • For each industry of main job m, take the hours worked in secondary jobs (by workers whose main job is in industry m) and multiply it by the proportion of job holders who hold a secondary job in industry s, to get an estimate of hours worked in secondary jobs in industry s by workers whose main job is in industry m. These proportions are taken from the LEED.
  • Sum the values from step 2b to get estimates of all hours worked in secondary jobs by industry of secondary job.

The exception to the above is for estimates of hours worked by permanent defence force personnel, which are sourced from quarterly Australian National Accounts data. All hours worked by those personnel are allocated to Australian and New Zealand Standard Industrial Classification (ANZSIC) subdivision 76 (Defence) within Public Administration and Safety (Division O), as conditions of employment assume that secondary jobs are not allowed.

Scope adjustments

Hours actually worked in all jobs derived from the Labour Force Survey are adjusted to align with the production and residency boundaries of the Australian System of National Accounts (ASNA) by including estimates of hours worked by child workers, non-residents living in Australia employed by Australian resident enterprises and members of the permanent defence forces, and excluding hours worked by Australian residents employed by non-resident enterprises. The estimated numbers of jobs held by persons in each category are taken from the Jobs quadrant.

Estimates for the number of hours actually worked by non-residents living in Australia employed by Australian resident enterprises are based on visa type. For short term students, the number of hours is capped at twenty hours per week as this is a work condition of student visas during university/school semesters. For other short term arrivals (excluding students), an average hours actually worked per job is estimated at half (50%) of the hours actually worked by the general resident population. While half is a crude estimate, it is assumed that non-residents would work less than the average hours worked by residents, to account for a holidaying component of their trip to Australia. Quarterly hours actually worked by Australian residents living in Australia employed by non-resident enterprises are also based on the quarterly average hours worked per job estimates.

Hours worked by child workers are derived based on data from the 2006 Survey of Child Workers. Quarterly hours actually worked by child workers are calculated by multiplying the relevant quarterly estimate of employed children by the average number of hours worked from the 2006 Survey of Child Workers.

Hours worked by permanent defence force personnel are not specifically adjusted for in the Australian Labour Account, as the underlying Australian National Accounts estimates used in the Australian Labour Account include an adjustment for hours worked by permanent defence personnel. The Australian National Accounts estimate of hours worked assumes that permanent defence personnel work the same number of hours in their jobs as average hours worked in main jobs by the general population.

Hours worked by the adjusted scope populations are allocated to industry as described in the table below.

Scope adjustmentAllocation to industry
Australian residents working in Australia employed by non-resident enterprisesHours worked are deducted from the Public Administration and Safety (ANZSIC Division O) industry, as most people in this category are locally engaged by foreign embassies, consulates and so on.
Students on short term visasHours allocated in the same proportions as the calculated estimates of main jobs held by short term students, i.e. based on resident full-time tertiary students aged 15-24 years.
Short term working visa holdersHours allocated in the same proportions as the calculated estimates of main and secondary jobs held by short term non-students.
Child workers under 15 yearsHours allocated in the same proportions as the calculated estimates of employed children, i.e. based on 15 year old employed persons from the LFS. Child workers under 15 years are assumed to hold only main jobs.

Hours sought but not worked

Hours sought but not worked are estimated by aggregating hours sought by the unemployed and additional hours preferred by the underemployed. Hours sought by unemployed persons are the hours unemployed persons could work if they were employed. Additional hours preferred by underemployed persons are the potential hours of employed people that are not fully utilised. It includes people employed part-time who want to and are available to work more hours, as well as people employed full-time who worked part-time hours in the survey reference week for economic reasons.

Both series are sourced from Labour Force, Australia, Detailed, Quarterly. Input data from the Labour Force Survey are not available prior to 2014. For earlier time periods, an average hours sought based on data from 2014 to 2017 is multiplied by the number of unemployed and underemployed persons. Data are further multiplied by 13 to derive a quarterly estimate from the weekly data representative of the Labour Force Survey reference week.

It should be noted that industry estimates for the unemployed population (and therefore the hours sought by those unemployed persons) are based on industry of last job worked (within the past two years) from the Labour Force Survey. This does not necessarily equate to the industries in which unemployed persons are currently seeking work, nor do they include those who have never held a job previously. Similarly, it is assumed that any additional hours sought by the underemployed are sought in the same industry as the main job of each underemployed person. As such, care should be exercised when interpreting estimates of hours sought on an industry basis.

No adjustments have been made to align the Labour Force Survey hours sought with the ASNA residency and production boundaries, as there is no reliable information to derive estimates of additional hours of work sought by short term working visa holders. It is also assumed that defence force personnel and child workers are fully employed.

Available hours of labour supply

Available hours of labour supply are the total number of hours for which people in the labour force are prepared to make themselves available for work. It is the sum of hours actually worked in all jobs, including adjustments for scope, and hours sought but not worked.

Hours paid for

Total hours paid for, at both an industry and total economy level, is calculated by adding quarterly estimates of ordinary and overtime hours paid. In addition, ordinary time hours paid is calculated separately for Owner Managers of Unincorporated Enterprises to other Status in Employment types.

Hours paid for – Owner Managers of Unincorporated Enterprises

To calculate hours paid for Owner Managers of Unincorporated Enterprises, it is assumed that hours paid for in this group are equivalent to the number of hours actually worked, as they would generally have no entitlement to any form of paid leave.

As such, the total number of hours paid for Owner Managers of Unincorporated Enterprises are calculated for each industry by taking the average number of hours actually worked in the reference week by this group from the Labour Force Survey, and multiplying the weekly average by the number of Owner Managers of Unincorporated Enterprises in that industry. The result is then further multiplied by 13 weeks to derive a quarterly estimate. These figures, estimated at an industry level, are summed to produce a ‘whole of economy’ total.

Hours paid for – Other Status in Employment types

In calculating hours paid for other Status in Employment types, average weekly ordinary time hours paid and average weekly overtime hours paid for each industry are derived from underlying data from the EEH. To calculate both overtime and ordinary hours paid for, average weekly measures are multiplied by the number of filled jobs in each industry, less Owner Managers of Unincorporated Enterprises. The filled jobs data are taken from the Jobs quadrant, while the number of Owner Managers of Unincorporated Enterprises is taken from the Persons quadrant. As the survey data reflects a ‘typical week’, quarterly estimates of total ordinary and overtime hours paid for are derived by multiplying the average weekly data by 13 weeks. Similar to the hours paid for Owner Managers of Unincorporated Enterprises, figures estimated at an industry level are summed to produce a ‘whole of economy’ total.

Prior to 2014, the two average weekly hours series for ordinary time hours paid and paid overtime were only available for non-managerial employees (refer to Labour Payments Concepts for a definition). From the 2014 release of the publication Employee Earnings and Hours, Australia (ABS cat. no. 6306.0), these series are available for all employees, which includes managerial employees where there is a link between pay and hours worked. The all employees series are used in Australian Labour Account hours paid for estimates where available. Internal analysis conducted during the development of the Australian Labour Account showed that the all employees series did not differ noticeably from the non-managerial employees series, therefore no adjustments have been made for scope for years prior to 2014.

In addition, as the EEH is a biennial survey, average weekly hours paid data for years where EEH survey data are not available are estimated as the average of the two neighbouring years. For example, average weekly hours paid data for 2013 are calculated as the average of EEH data for 2012 and 2014. EEH data are also not available on the current industry classification basis prior to 2008. Data for earlier time periods have been estimated by matching current and historical industry classifications, as much as possible, at the industry subdivision level.

As Division A is out of scope of the Survey of Employee Earnings and Hours, the calculation of hours paid for the Agriculture Forestry and Fishing Industry (ANZSIC Division A) applies the average hours paid for Division I (Transport, Postal and Warehousing).

Annual labour volume methods

As all data contained in the Labour Volume quadrant are flow data, which represent a measure of activity over a given period, data across time periods are additive. Therefore, annual data in the Labour Volume quadrant are derived as the sum of the four quarterly estimates.

It should be noted that the Labour Volume quadrant includes derived measures such as Average hours worked per job and Average hours worked per Labour Account employed person. These are calculated using a flow as the numerator (e.g. Hours actually worked), divided by a stock for the denominator (e.g. Filled jobs). Where these data are presented in annual terms, caution must be exercised when comparing this result with other estimates measured at the same point in time. These data are intended for comparison across time and industries within the Australian Labour Account, and to provide a link between the Jobs and Labour Volume quadrants.

Hours quadrant calculations

Hours quadrant sources and calculations

Hours quadrant sources and calculations
The diagram shows that: Average weekly ordinary hours paid for by industry (EEH) multiplied by 13 weeks per quarter equals Ordinary hours paid by industry (non OMUEs). Average weekly hours worked by OMUEs by industry (LFS) multiplied by Number of OMUEs per industry (LFS) multiplied by 13 weeks per quarter equals Ordinary hours paid by industry (OMUEs). Ordinary hours paid by industry (non OMUEs) plus Ordinary hours paid by industry (OMUEs) equals Labour Account total ordinary hours paid by industry. Average weekly overtime hours paid by industry (EEH) multiplied by Labour Account filled jobs (business sources) by industry (less OMUEs from LFS) multiplied by 13 weeks per quarter equals Labour Account overtime hours paid by industry. Labour Account total ordinary hours paid by industry plus Labour Account overtime hours paid by industry equals Labour Account total hours paid by industry.
Hours quadrant sources and calculations
The diagram shows that: Weekly hours worked in main jobs by industry (LFS) plus Weekly hours worked in secondary jobs by industry (LFS and LEED) equals Industry proportions of hours worked (LFS and LEED) multiplied by Total hours actually worked (LFS) equals Hours actually worked by industry. Hours worked by short-term arrivals (non students) plus Hours worked by short-term arrivals (students) plus hours worked by children less Hours worked by residents overseas equals Adjustment to hours worked. Hours actually worked by industry plus Adjustment to hours worked equals Labour Account hours worked by industry. Labour Account total hours paid less Labour Account hours worked equals Residual - Hours quadrant.
Hours quadrant sources and calculations
The diagram shows that: Average weekly hours sought by unemployed persons by industry (LFS) multiplied by Number of unemployed persons multiplied by 13 weeks per quarter equals Hours sought by unemployed by industry. Average weekly additional hours sought by underemployed persons by industry (LFS) multiplied by Number of underemployed persons multiplied by 13 weeks per quarter equals Additional hours sought by underemployed by industry. Hours sought by unemployed plus Additional hours sought by underemployed equals Available hours of labour supply.

Payments quadrant

The Labour Payments quadrant accounts for the costs incurred by enterprises in employing labour and the incomes received by people from its provision.

Payments quadrant

Payments quadrant
The diagram shows that: Total Labour cost divided by Hours worked equals Average cost per hour worked. Total Labour cost divided by Hours paid equals Average cost per hour paid. Total Labour cost equals Total labour income plus Employment related costs plus Payroll tax less Employment subsidies. Compensation of employees plus Labour income from self-employment equals Total labour income. Total labour income divided by Employed persons equals Average labour income per employed person.

Payment concepts

The conceptual framework for statistical measures of employee remuneration in Australia (in the context of the broader concept of labour costs) are discussed in the Earnings chapter. The narrowest concept outlined in the international guidelines is that of 'Earnings'. Concepts of 'Wages and salaries', 'Employee income', 'Compensation of Employees' and 'Labour costs' all include and extend upon the concept of 'Earnings'.

The statistical measure of labour costs is based on the concept of labour as a cost to the employer and relates to:

  • all cash and in-kind payments of wage and salaries to employees;
  • all contributions by employers in respect of their employees to social security, private pension, casualty insurance, life insurance and similar schemes; and
  • all other costs borne by employers in the employment of labour that are not related to employee compensation (such as costs of training, welfare services to employees, payroll taxes etc.).

Measures of labour costs should be net of any subsidies, rebates or allowances from governments for wage and salary payments to employees, or for other labour costs borne by employers.

The definition of labour costs from the 1966 International Conference of Labour Statisticians, paragraph 39 is ‘...remuneration for work performed, payments in respect of time paid for but not worked, bonuses and gratuities, the cost of food, drink and other payments in kind, cost of workers' housing borne by employers, employers' social security expenditures, cost to the employer for vocational training, welfare services and miscellaneous items, such as transport of workers, work clothes and recruitment together with taxes...’.

Payments sources

Source data for quarterly estimates of labour payments

Labour payments data are primarily sourced from underlying data from two ABS National Accounts publications: Australian System of National Accounts and the Australian National Accounts: National Income, Expenditure and Product. Please refer to Chapter 11 of the Australian System of National Accounts: Concepts, Sources and Methods for details on how data are compiled for National Accounts.

Data components of other labour related costs to employers are sourced from the Australian National Accounts: Input-Output Tables, Product Details and underlying information from ABS Supply-Use tables.

The table below summarises data sources used in compiling quarterly estimates in the Labour Payments quadrant.

Source dataUse in compiling quarterly data
Australian System of National AccountsUsed in compiling estimates of labour income from self-employment.
Australian National Accounts: National Income, Expenditure and ProductUsed in compiling estimates of Compensation of employees, payroll taxes and labour income from self-employment.
Australian National Accounts: Input-Output Tables, Product DetailsUsed in compiling estimates of training costs and recruitment costs.
ABS Supply-Use tablesUsed in compiling estimates of employment subsidies, training costs and recruitment costs.
Government Finance Statistics, AustraliaUsed in compiling estimates of employment subsidies.
Job Vacancies, AustraliaUsed in compiling quarterly estimates of Recruitment costs.
Business Indicators, AustraliaUsed in compiling quarterly estimates of Training costs.

Source data for annual estimates of labour payments

Source data for the annual estimates of labour payments are the same as those described above for quarterly estimates.

Payments methods

Methods for the compilation of quarterly and industry estimates of labour payments

Total labour income

Total labour income is the sum of:

  • Compensation of employees; and
  • Labour income from self-employment.

Total labour costs

Total labour costs is the sum of:

  • Total labour income; and
  • Other employment related costs.

Estimates of Compensation of employees at a total economy and industry division level are derived from underlying Australian National Accounts data. Division level data from the Australian National Accounts is further disaggregated to industry subdivision, using Compensation of employees information from the ABS Supply-Use tables for most industries. For some industries, the Supply-Use industries are more aggregated than industry subdivision. For these industries, information from the annual Economic Activity Survey or the proportion of filled jobs from business sources is used to disaggregate data to industry subdivision. One exception is Division S (Other Services), which uses information relating to earnings in all jobs from the household Characteristics of Employment Survey to disaggregate data to industry subdivision, as subdivision 96 (Private Households Employing Staff) is out of scope of all business collections.

Quarterly Compensation of Employees data are not available prior to September 2002. For earlier time periods, data at industry division level are backcast by applying movement in gross earnings from Wage and Salary Earners, Australia to the September 2002 level. These data relate to both the public and private sectors for each industry division except for Division A (Agriculture, Forestry and Fishing), which is limited to the public sector only. As the data are also on a historical industry classification basis, conversion factors (based on annual Australian National Accounts Compensation of Employees benchmark data) are also applied to approximate the current industry classification. These backcast quarterly data are then benchmarked to published annual levels.

Labour income from self-employment is an estimate of the share of Gross Mixed Income (GMI) attributable to the provision of labour. GMI is the surplus or deficit accruing from production by unincorporated enterprises that includes both the return on labour and return on capital.

The calculation of the labour share of GMI on an annual basis for each industry follows the method described in compiling Productivity Statistics outlined in Chapter 19 (Productivity Measures) of the Australian System of National Accounts: Concepts, Sources and Methods. This method assumes that self-employed proprietors receive the same average compensation per hour as wage and salary earners, and can be summarised as comprising the following steps:

  1. Average hourly income of wage and salary earners in each industry is calculated by dividing Compensation of Employees by the estimated number of hours worked in all jobs by employees in the industry (excluding the self-employed).
  2. This hourly rate is then multiplied by the estimated number of hours worked by self-employed persons (OMUEs) whose main job is classified to the industry. This information is derived by expanding the average number of hours worked in the reference weeks recorded in the Labour Force Survey by the number of weeks in the quarter and aggregating for the year.
  3. This estimate is then multiplied by a scaling factor, to constrain to total industry GMI reported in the National Accounts. The scaling factor represents the ratio of the sum of the independently calculated labour and capital shares of GMI, for each industry, to the independently calculated estimate of total industry GMI reported in the National Accounts. This difference can arise from the use of different sources and methods to derive estimates of returns to labour and capital, to the method used by national accounts in calculating total GMI.
  4. As productivity statistics are not compiled for industries with significant “non-market” components, no GMI scaling factor is applied to estimated self-employed labour income for Division P (Education and Training) and Division Q (Health Care and Social Assistance).
  5. No GMI is estimated for Division D (Electricity, Gas, Water and Waste Services), Division K (Financial and Insurance Services) and Division O (Public Administration and Safety), as there are no owner managed unincorporated enterprises (OMUEs) classified to these industries.

The Australian Labour Account calculates quarterly labour income from self-employment for each industry division by taking the scaled labour share of GMI from underlying Australian National Accounts productivity data, as calculated using the steps described above, and applying this share to the total level of quarterly GMI for each industry division. This approach ensures consistency between Australian Labour Account estimates of labour income from self-employment and Australian National Accounts GMI data.

As productivity statistics are not compiled for Division P (Education and Training) and Division Q (Health Care and Social Assistance), the scaled labour share of GMI for Division M (Professional, Scientific and Technical Services) is applied to total quarterly GMI for these industries. In addition, the scaled labour share of GMI for Division I (Transport, Postal and Warehousing) is used to represent Division A (Agriculture, Forestry and Fishing) while the scaled labour share of GMI for Division A is further investigated.

As industry productivity statistics are only compiled annually, the same annual scaled labour share of GMI is applied to each quarterly GMI measure for the financial year.

To disaggregate estimates of labour income from self-employment for each industry division to subdivision level, Gross Operating Surplus information from the ABS Supply-Use tables is used for most industries. For some industries, the Supply-Use industries are more aggregated than industry subdivision. For these industries, information from the annual Economic Activity Survey is used.

Quarterly GMI data are not available prior to September 2001. For earlier time periods, data at the industry division level are backcast by applying movements in original Gross Value Added (chain volumes) to the September 2001 level. These backcast data are then benchmarked to annual scaled GMI. For Division P (Education and Training) and Division Q (Health Care and Social Assistance), labour income from self-employment is backcast directly by applying movements in Gross Value Added (chain volumes).

Other employment costs

Other employment costs are the sum of

  • Employers payroll taxes;
  • Payment for recruitment services;
  • Training costs; less
  • Employment subsidies.
Employers payroll taxes

Estimates for employers’ payroll taxes at industry division level are taken from underlying Australian National Accounts estimates. Division level data from the Australian National Accounts is further disaggregated to industry subdivision, using Compensation of Employees information from the ABS Supply-Use tables for most industries. For some industries, the Supply-Use industries are more aggregated than industry subdivision. For these industries, information from the annual Economic Activity Survey is used.

Payment for Recruitment services and Training costs

Estimates of annual total expenditure on recruitment services are calculated as the sum of Intermediate Use (purchase price) and Government Final Consumption Expenditure sourced from the Australian National Accounts: Input-Output Tables, Product Details for Input-Output Product Classification (IOPC) 72110010 (Employment placement and recruitment services). Total quarterly job vacancies from Job Vacancies, Australia (ABS cat. no. 6354.0) are used as a quarterly indicator series to distribute this annual total across the four financial year quarters.

Training Costs are similarly derived and sourced from the Input-Output tables, using the following IOPC codes:

  • IOPC 81010010 Technical, vocational and other non-tertiary education services;
  • IOPC 81020010 Tertiary higher education services (including undergraduate and postgraduate);
  • IOPC 82120010 Arts education services (excluding vocational);
  • IOPC 82190011 Adult, community and other education services; and
  • IOPC 82200010 Education support services.

Total wages and salaries for Division P (Education and Training) from Business Indicators, Australia are used as a quarterly indicator series to distribute this annual total across the four financial year quarters. As these data are not available prior to March 2001, data for earlier time periods are backcast by applying movements in private sector gross earnings from Wage and Salary Earners, Australia to the March 2001 level.

As Input-Output tables are only available infrequently for earlier periods and with a significant time lag for more recent periods, estimates of total annual expenditure on recruitment services and training costs for the intervening and out years are compiled using underlying data from the Supply-Use tables, based on applying movements in the following Supply-Use Product Classification (SUPC) codes:

  • SUPC 72005 Employment placement and recruitment services;
  • SUPC 80205 Technical, vocational and tertiary education services; and
  • SUPC 80310 Arts, adult and other education services.

Supply-Use tables also provide proportions used to allocate total quarterly expenditure on recruitment services and training costs to industry subdivision. These proportions are based on total intermediate use of these products for each Supply-Use industry, with information from the Economic Activity Survey used for those industries where Supply-Use industries are more aggregated than industry subdivision.

Employment subsidies

Employment subsidies are payments made by government, typically to employers. They may be based on the size of the total workforce, the employment of particular types of people such as those who are physically handicapped or who have been unemployed for long periods. These subsidies may also be intended to cover some or all of the costs of training schemes organised or financed by employers.

Information on employment subsidies is sourced from data provided by the Department of Finance to compile estimates for the publication Government Finance Statistics, Australia – specifically, data relating to “labour market assistance to jobseekers”. As data for the current year employment subsidies estimate is not available at the time of publication of the Australian Labour Account, annual data for the current year are modelled based on previous years’ movements.

Typically, only annual data are available for estimates of employment subsidies. Therefore, quarterly estimates of employment subsidies are derived by evenly distributing the annual estimate across the four quarters. However, additional subsidies payable for a specific purpose may be added in targeted quarters to specific industries. 

Employment subsidies data from Government Finance Statistics, Australia are not available prior to 2010-11. Estimates for earlier time periods are modelled based on movements in a similar GFS data item, namely “Commonwealth subsidies paid to other”, where “other” refers to other than public trading enterprises.

To allocate employment subsidies to industry subdivision, data from the Supply-Use tables for subsidies on production by Supply-Use industry are used to derive industry proportions, with information from the Economic Activity Survey used for those industries where Supply-Use industries are more aggregated than industry subdivision.

Method for the compilation of annual estimates of labour payments

As all data contained in the Labour Payments quadrant are flow data, which represent a measure of activity over a given period, data across time periods are additive. Therefore, annual data in the Labour Payments quadrant are derived as the sum of the four quarterly estimates.

It should be noted that the Labour Payments quadrant includes derived measures such as Average labour Income per employed Person. These are calculated using a flow as the numerator (e.g. Labour income), divided by a stock for the denominator (e.g. Labour Account employed persons). Where these data are presented in annual terms, caution must be exercised when comparing this result with other estimates measured at the same point in time, such as estimates of Average Weekly Earnings. This data is intended for comparison across time and industries within the Australian Labour Account, and to provide a link between the Persons and Labour Payments quadrants.

Payments quadrant calculations

Payments quadrant sources and calculations

Payments quadrant sources and calculations
The diagram shows that: Placement and recruitment services costs (IO tables) multiplied by Movements in related supply use products (non 10 years) equals Annual placement and recruitment services split by Using job vacancies as a quarterly indicator series equals Placement and recruitment services costs by quarter. Placement and recruitment services costs multiplied by Industry weights from annual supply use tables equals Placement and recruitment services costs by industry. Training costs (IO tables) multiplied by Movements in related supply use products (non 10 years) equals Annual training costs split by Using QBIS education outputs as a quarterly quarterly indicator series equals Training costs by quarter. Training costs multiplied by Industry weights from annual supply use tables equals Training costs by industry. Annual labour market assistance to jobseekers (GFS) divided by Four quarters equals Employment subsidies by quarter multiplied by Industry weights - subsidies on production (supply use tables) equals Employment subsidies by industry. Placement and recruitment services costs plus Training costs plus Employers payroll taxes (NAB) less Employment subsidies equals Other related costs to employers. Labour share of GMI (NAB) multiplied by Quarterly industry GMI (NAB) equals Labour income from self-employment. Compensation of employees (NAB) plus Other related costs to employers plus Labour income from self-employment equals Total labour costs. Labour income from self-employment plus Compensation of employees (NAB) equals Total labour income. Total labour costs less Total labour income equals Residual - Payments quadrant.