07/05/2007 NOTE: The March 2007 issue of International Trade in Good and Services, Australia (cat. no. 5368.0) has been re-issued to correct one paragraph in the Analysis and Comments. The paragraph under the heading of Exports of Goods and Services was reported as presenting the revised December quarter deficit on goods and services but the previously published December quarter deficit was published. This re-issue has the correct revised December quarter 2006 goods and services deficit and consequentially the correct December quarter 2006 to March quarter 2007 movement.
No other information or data released with this issue are affected.
MARCH KEY FIGURES
 | January 2007 | February 2007 | March 2007 | Feb 07 to Mar 07 | |
| $m | $m | $m | % change | |
TREND | |
| |
| Balance on goods and services | -1 131 | -1 159 | -1 172 | . . | |
| Credits (exports of goods & services) | 18 061 | 18 128 | 18 190 | - | |
| Debits (imports of goods & services) | 19 192 | 19 287 | 19 362 | - | |
SEASONALLY ADJUSTED | |
| |
| Balance on goods and services | -843 | -728 | -1 622 | . . | |
| Credits (exports of goods & services) | 18 066 | 18 632 | 17 839 | -4 | |
| Debits (imports of goods & services) | 18 909 | 19 360 | 19 461 | 1 | |
| |
| . . not applicable |
| - nil or rounded to zero (including null cells) |
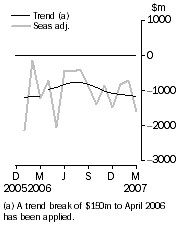
Balance on goods and services
| |
MARCH KEY POINTS
TREND ESTIMATES
- The provisional trend estimate of the balance on goods and services was a deficit of $1,172m in March 2007, an increase of $13m on the revised deficit in February.
- Goods and services credits rose $62m to $18,190m. Goods and services debits rose $75m to $19,362m.
SEASONALLY ADJUSTED ESTIMATES
- In seasonally adjusted terms, the balance on goods and services was a deficit of $1,622m in March, an increase of $894m on the revised deficit in February.
- Goods and services credits fell $793m (4%) to $17,839m. Non-rural and other goods fell $819m (6%) while rural goods rose $8m. Services credits rose $19m.
- Goods and services debits rose $101m (1%) to $19,461m. Intermediate and other goods rose $315m (4%) and capital goods rose $13m while consumption goods fell $203 (4%). Services debits fell $23m (1%).
ORIGINAL ESTIMATES
- In original terms, the March 2007 balance on goods and services was a deficit of $991m, an increase of $824m on the revised deficit in February. Goods and services credits rose $709m (4%) and goods and services debits rose $1,533m (9%).
- In the nine months to March, exports of non-rural and other goods were up $13.9b (15%) and rural goods were up $0.5b (3%) on the corresponding period in 2005-06.
NOTES
FORTHCOMING ISSUES
| ISSUE | Release Date |
| April 2007 | 31 May 2007 |
| May 2007 | 4 July 2007 |
| June 2007 | 1 August 2007 |
| July 2007 | 31 August 2007 |
| August 2007 | 3 October 2007 |
| September 2007 | 1 November 2007 |
REVISIONS
Revisions were made to incorporate the latest available data relating to merchandise trade, the quarterly survey of international trade in services and other administrative data. In original terms, these revisions have:
- decreased the deficit on goods and services for February 2007 by $41m
- decreased the deficit on good and services for the eight months to February by $104m
- increased the deficit on goods and services for 2005-06 by $68m.
CHANGES TO THIS ISSUE
As announced in both the January and February issues, the format of the datacube containing seasonal adjustment factors has changed to align with the current standard of excel spreadsheets. The new format is available as Table 91.
AVAILABILITY OF DETAILED SERVICES DATA
The trade in services data cubes, listed under Time Series Data on page 4, for data on a calendar year basis to 2006 have been updated concurrently with this issue.
INQUIRIES
For further information about these and related statistics, contact the National Information and Referral Service on 1300 135 070 or Tom Jebbink on Canberra (02) 6252 5540.
 Print Page
 Print All