SUMMARY OF FINDINGS
Overview
This publication contains preliminary statistics on average weekly earnings of employees. It also includes preliminary estimates of the proportion of employees whose pay is set by award only, collective agreement and individual arrangement. The statistics are based on the Survey of Employee Earnings and Hours conducted in respect of May 2004.
Final estimates will be published in Employee Earnings and Hours, Australia, May 2004 (cat. no. 6306.0).
Average weekly total earnings
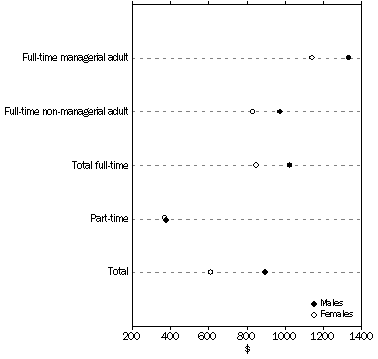
- Average weekly total earnings was $758.80 for all employees, $898.40 for male employees and $613.40 for female employees.
- Average weekly total earnings was $974.40 for full-time adult employees, $403.60 for full-time non-managerial junior employees and $375.30 for all part-time employees.
- Average weekly total earnings for all employees in the public sector was $902.50 compared with $718.70 in the private sector.
- Average weekly total earnings for public sector employees were higher than those for private sector employees for all managerial and non-managerial categories.
- Average weekly total earnings for all employees was highest in the Mining industry ($1,533.00) and lowest in the Retail trade ($448.40) and Accommodation, cafes and restaurants ($462.80) industries.
- Average weekly total earnings for full-time non-managerial employees was highest in New South Wales ($952.30) and lowest in South Australia ($834.70).
Average Weekly Total Earnings, May 2004

Pay setting methods
- In May 2004, the most common method of setting pay for employees was collective agreement (42.1%).
- In the private sector, the most common method of setting pay for all employees was individual arrangement (excluding working proprietors of incorporated businesses) (40.7%), while in the public sector it was collective agreement (93.1%).
- The Accommodation, cafes and restaurants industry had the highest proportion of employees whose pay was set by award only (60.2%). The Government, administration and defence industry had the highest proportion of employees whose pay was set by collective agreement (91.3%). The Wholesale trade industry had the highest proportion of employees (excluding working proprietors of incorporated businesses) whose pay was set by individual arrangement (60.6%).
- The Australian Capital Territory and Northern Territory had the highest proportion of employees whose pay was set by collective agreements (57.3% and 56.7% respectively). South Australia had the highest proportion of employees whose pay was set by award only (26.2%).
Methods of setting pay, May 2004

NOTES
ABOUT THIS PUBLICATION
This publication contains preliminary estimates obtained from a sample survey of employers conducted in respect of May 2004.
The survey is designed to provide statistics on the composition and distribution of earnings and hours paid for, of employees, and how their pay is set. Final estimates will be published in Employee Earnings and Hours, Australia, May 2004 (cat. no. 6306.0), expected to be released in March 2005.
RELATED ISSUE
Employee Earnings and Hours, Australia, May 2004 (cat. no. 6306.0)
ISSUE EXPECTED RELEASE DATE
May 2004 March 2005
NOTES ON ESTIMATES
Care should be taken when comparing estimates of average weekly earnings in this publication with those published quarterly in Average Weekly Earnings, Australia (cat. no. 6302.0) because of methodological differences between the two surveys, differences in the two samples used, and the preliminary nature of these estimates.
The estimates contained in this publication may differ from the final data to be released in Employee Earnings and Hours, Australia, May 2004 (cat. no. 6306.0).
ABS DATA AVAILABLE ON REQUEST
In addition to the information contained in this publication, a range of unpublished data is available on request. For more information refer to the Appendix.
SAMPLING ERROR
For information on sampling error refer to the Technical Note.
INQUIRIES
For further information about these and related statistics, contact the National Information and Referral Service on 1300 135 070 or Valerie Pearson on Perth (08) 9360 5374.
 Print Page
 Print All