 BARLEY AND SELECTED OTHER GRAINS AND PULSES
STOCKS OF BARLEY AND SELECTED OTHER GRAINS AND PULSES
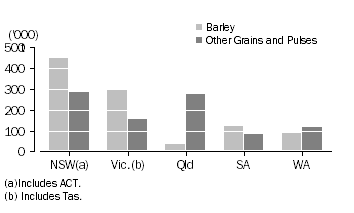
In March 2011, there were 992 thousand tonnes of barley stored by wheat users in Australia, an increase of 596 thousand tonnes from the September 2010 quarter when estimates were last collected. New South Wales wheat users held the greatest amount of barley in March 2011, storing 449 thousand tonnes, followed by Victoria with 295 thousand tonnes. Total stocks were 56 thousand tonnes (5%) lower than for the March 2010 quarter.
There were 914 thousand tonnes of selected other grains and pulses stored by wheat users in Australia in March 2011, an increase of 637 thousand tonnes from the last collection in September 2010. Wheat users in New South Wales held the greatest amount, storing 286 thousand tonnes, followed by Victoria with 156 thousand tonnes. Compared to the March 2010 quarter, stocks were 214 thousand tonnes (31%) higher in the March 2011 quarter.
STOCKS OF BARLEY AND OTHER GRAINS AND PULSES, March 2011

 Print Page
 Print All
 Quality Declaration