 CHAPTER 4 INDICATIVE IMPACTS ON INTERNATIONAL ACCOUNTS
| Warning: The estimates in this publication are indicative. They are presented to give an indication of the magnitude of the impacts of proposed change to Australia's macro-economic accounts. All estimates are subject to refinement and revision in the quarterly balance of payments to be published on 8 December 2009. |
BALANCE OF PAYMENTS
From the August 2009 issue of International Trade in Goods and Services (5368.0) and the September quarter 2009 issue of Balance of Payments and International Investment Position (5302.0), data will be compiled on the basis of the Balance of Payments and International Investment Position Manual sixth edition (BPM6). In addition, the results of a number of data quality investigations will be implemented. These changes will be backcast through the historical series to create a time series which is as continuous as possible.
New series to be introduced with BPM6 include pension funds service charge, reinvested earnings on investment fund shares and other volume changes due to migrants' change in residency. A range of series will be revised including transport freight services, all insurance service charges, financial services, financial intermediation services indirectly measured (FISIM) and personal transfers.
THE BALANCE OF PAYMENTS AND INTERNATIONAL INVESTMENT POSITION
Table 1 summarises the impact on key aggregates for 2007-08 of implementing BPM6. The reasons for the most significant changes are described in the following sections.
1 Summary of changes to Balance of Payments and International Investment Position, current prices(a) |
|
| BPM6 Label | BPM5 basis ($m) | BPM6 basis ($m) | Difference | % change |
|
| CURRENT ACCOUNT | -72 504 | -72 987 | -483 | -1 |
| Goods and Services | -23 561 | -24 579 | -1 018 | -4 |
| Net Goods | -22 346 | -21 894 | 452 | - |
| Goods credits | 182 818 | 182 952 | 134 | - |
| Goods debits | -205 164 | -204 846 | 318 | - |
| Net Services | -1 215 | -2 685 | -1 470 | - |
| Services credits | 51 035 | 50 645 | -390 | -1 |
| Services debits | -52 250 | -53 330 | -1 080 | -2 |
| Net Primary income | -48 601 | -48 254 | 347 | - |
| Primary income credits | 42 022 | 43 035 | 1 013 | 2 |
| Primary income debits | -90 623 | -91 289 | -666 | -1 |
| Net Secondary income | -342 | -154 | 188 | - |
| Secondary income credits | 5 264 | 6 058 | 794 | 15 |
| Secondary income debits | -5 606 | -6 212 | -606 | -11 |
 |  |  |  |  |
| CAPITAL ACCOUNT | 2 167 | -232 | -2 399 | n.a. |
 |  |  |  |  |
| FINANCIAL ACCOUNT | 68 148 | 72 206 | 4 058 | 6 |
| Financial account assets | 92 260 | 85 003 | -7 257 | -8 |
| Financial account liabilities | 160 408 | 157 209 | -3 199 | -2 |
 |  |  |  |  |
| INTERNATIONAL INVESTMENT POSITION |  |  |  |  |
 | Total foreign assets | 1 048 612 | 1 069 706 | 21 094 | 2 |
 | Total foreign liabilities | 1 724 482 | 1 729 944 | 5 462 | - |
|
| - nil or rounded to zero (including null cells) |
| (a) Balance of Payments signage presented in this table according to BPM6 presentation |
THE CURRENT ACCOUNT
The Current Account presentation under BPM6 will be similar to the presentation currently published, except that income and current transfers will be replaced by primary income and secondary income, respectively.
The introduction of BPM6 will increase the current account deficit, in current prices, for 2007-08 by about $0.5 billion net with:
- the deficit on goods decreasing about $0.5 billion;
- the deficit on services increasing about $1.5 billion;
- the deficit on primary income decreasing about $0.4 million; and
- the deficit on secondary income decreasing about $0.2 billion
The gross impacts will be larger than the above net impacts although some of the changes, such as some components moving between goods and services, will have a minimal net impact.
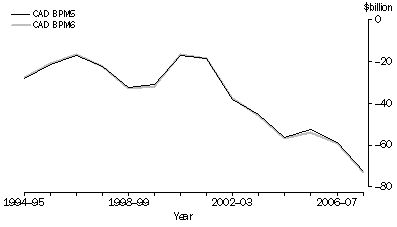
The impacts on the current account balances are summarised below for 1994-95 to 2007-08 in table 2 and figure 1.
2 Changes to Current Account Deficit, current prices |
|
 | 1994-95 | 1995-96 | 1996-97 | 1997-98 | 1998-99 | 1999-2000 | 2000-01 | 2001-02 | 2002-03 | 2003-04 | 2004-05 | 2005-06 | 2006-07 | 2007-08 |
 | $m | $m | $m | $m | $m | $m | $m | $m | $m | $m | $m | $m | $m | $m |
|
| CAD (BPM5) | -28 233 | -21 401 | -17 089 | -22 183 | -32 603 | -30 985 | -16 867 | -18 553 | -38 186 | -45 590 | -56 325 | -52 627 | -58 529 | -72 504 |
| Net change to Goods | 178 | 218 | 215 | 170 | 96 | 252 | 188 | 379 | 351 | 157 | 129 | -185 | 462 | 452 |
| Net change to Services | -476 | -448 | -591 | -804 | -1 039 | -882 | -514 | -795 | -725 | -700 | -794 | -649 | -936 | -1 470 |
| Net changes to Primary income | 287 | 222 | 117 | -83 | -332 | -96 | 43 | 102 | 520 | 139 | -84 | -119 | 294 | 347 |
| Net changes to Secondary income | 587 | 589 | 583 | 463 | 1 198 | 141 | 460 | 489 | 603 | 352 | 259 | -404 | -302 | 188 |
| CAD (BPM6) | -27 657 | -20 820 | -16 765 | -22 437 | -32 680 | -31 570 | -16 690 | -18 378 | -37 437 | -45 642 | -56 815 | -53 984 | -59 011 | -72 987 |
|
Figure 1 - Current Account Deficit, BPM5 and BPM6 basis
- current prices
THE GOODS ACCOUNT
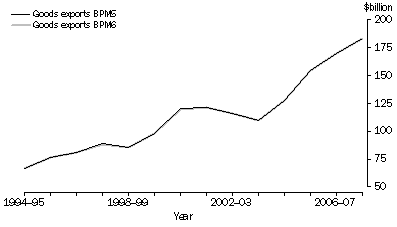
Revisions to goods credits (exports) as a result of BPM6 and the data quality investigations mainly impact the non-rural goods category. The overall impact is not significant, although the size of the impact varies from year to year. Between 1994-95 and 2007-08 the size of the revisions ranges between -$390 million and +$163 million.
The revisions will result from:
- goods subject to merchanting will be recorded under goods credits (merchanting had been recorded as a service) and incorporating a different definition of net merchanting.
- repairs on goods no longer will be recorded as goods (included in services and named maintenance and repair services n.i.e.).
- goods for processing no longer will be recorded as goods (the processing component is included in services and named manufacturing services on physical inputs owned by others).
- goods procured in ports by carriers will be reviewed and reclassified from the other goods category to the non-rural goods category under general merchandise.
- relatively small revisions as a result of data quality investigations.
3 Net changes to goods credits (exports), current prices |
|
 | 1994-95 | 1995-96 | 1996-97 | 1997-98 | 1998-99 | 1999-2000 | 2000-01 | 2001-02 | 2002-03 | 2003-04 | 2004-05 | 2005-06 | 2006-07 | 2007-08 |
 | $m | $m | $m | $m | $m | $m | $m | $m | $m | $m | $m | $m | $m | $m |
|
| Goods exports (BPM5) | 67 101 | 76 146 | 80 934 | 88 538 | 85 783 | 97 625 | 120 231 | 120 940 | 115 803 | 109 473 | 127 867 | 154 425 | 169 514 | 182 818 |
| Net change to Rural goods | 1 | 5 | -2 | -4 | - | 30 | - | 30 | 22 | -20 | - | - | 15 | 14 |
| Net change to Non-rural goods | 555 | 631 | 574 | 580 | 465 | 711 | 991 | 824 | 855 | 785 | 1 180 | 1 375 | 1 667 | 1 837 |
| Net change to Other goods | -466 | -473 | -449 | -531 | -612 | -681 | -1 021 | -727 | -785 | -820 | -1 235 | -1 765 | -1 672 | -1 717 |
| Goods exports (BPM6) | 67 191 | 76 309 | 81 057 | 88 583 | 85 636 | 97 685 | 120 201 | 121 067 | 115 895 | 109 418 | 127 812 | 154 035 | 169 524 | 182 952 |
|
| - nil or rounded to zero (including null cells) |
Figure 2 - Net goods credits (exports), BPM5 and BPM6 basis
- current prices
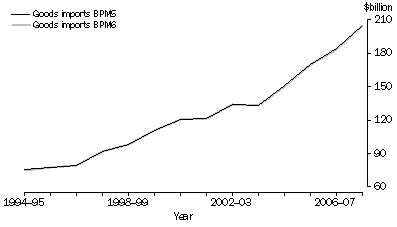
All goods debits (imports) series will be revised with the introduction of BPM6 and the data quality investigations. The overall impact will not be significant, although the size of the impact will vary from year to year. Between 1994-95 and 2007-08 the size of the revisions ranges between -$55 million and -$452 million.
The revisions will result from:
- repairs on goods no longer will be recorded as goods (included in services and named maintenance and repair services n.i.e.).
- goods for processing no longer will be recorded as goods (the processing component is included in services and named manufacturing services on physical inputs owned by others).
- goods procured in ports by carriers will be reviewed and reclassified from the other goods category to the intermediate and other merchandise goods category under general merchandise.
- goods will be valued on a Customs Value basis from 1989 onwards rather than on a Free on Board basis. Previously the Customs Value basis had only been used from 2006 onwards.
4 Net changes to goods debits (imports), current prices |
|
 | 1994-95 | 1995-96 | 1996-97 | 1997-98 | 1998-99 | 1999-2000 | 2000-01 | 2001-02 | 2002-03 | 2003-04 | 2004-05 | 2005-06 | 2006-07 | 2007-08 |
 | $m | $m | $m | $m | $m | $m | $m | $m | $m | $m | $m | $m | $m | $m |
|
| Goods imports (BPM5) | 75 317 | 77 729 | 79 438 | 92 084 | 98 430 | 110 810 | 120 524 | 121 943 | 134 273 | 133 018 | 150 873 | 169 716 | 184 024 | 205 164 |
| Net change to Consumption goods | 22 | 37 | 26 | 303 | 207 | 42 | 49 | 52 | 59 | 48 | 64 | 58 | - | - |
| Net change to Capital goods | 31 | 11 | -95 | -54 | -111 | -154 | -68 | -7 | -102 | -39 | 38 | 80 | 9 | -52 |
| Net change to Intermediate and other merchandise goods | 899 | 948 | 1 355 | 1 557 | 103 | 371 | 1 128 | 871 | 1 035 | 904 | 1 194 | 1 523 | 1 651 | 1 890 |
| Net change to Other goods | -1 040 | -1 051 | -1 378 | -1 931 | -442 | -451 | -1 327 | -1 168 | -1 251 | -1 125 | -1 480 | -1 866 | -2 112 | -2 156 |
| Goods imports (BPM6) | 75 229 | 77 674 | 79 346 | 91 959 | 98 187 | 110 618 | 120 306 | 121 691 | 134 014 | 132 806 | 150 689 | 169 511 | 183 572 | 204 846 |
|
| - nil or rounded to zero (including null cells) |
Figure 3 - Net goods debits (imports), BPM5 and BPM6 basis
- current prices
THE SERVICES ACCOUNT
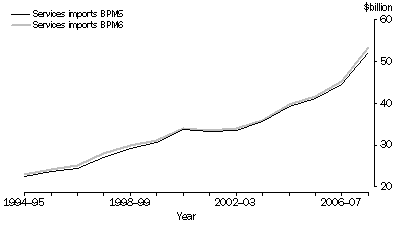
Introducing revised standards and results of the data quality investigations will have a greater impact on services than on goods in both absolute and percentage terms. The size of the impact varies from year to year. BPM6 introduces a new series, pension funds service charge, and a number of series will be revised including transport freight services, insurance service charge and financial services including financial intermediation services indirectly measured (FISIM).
The revisions will result from:
- the exclusion of merchanting services (credits only).
- the inclusion of maintenance and repair services n.i.e..
- the inclusion of manufacturing services on physical inputs owned by others.
- introduction of new or revised models for estimating:
- pension funds service charge,
- insurance service charge,
- transport freight services (debits),
- financial services including FISIM.
In addition, more detailed services classifications will be introduced to align with the Manual on Statistics of International Trade in Services and the Extended Balance of Payments Services classification.
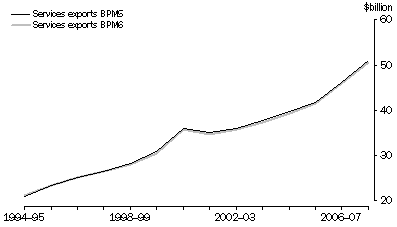
Between 1994-95 and 2007-08, the impact on services credits will range between -$435 million and +$162 million (table 5). The major changes will be due to the removal of merchanting services and the introduction of new models for: insurance service charge; pension funds service charge; and financial services including FISIM.
Between 1994-95 and 2007-08, the impact on services debits will range between +$265 million and +$1,080 million (table 6). The major changes will be due to the introduction of: new models for transport freight services; insurance service charge; pension funds service charge; and financial services including FISIM; and the inclusion of maintenance and repair services n.i.e..
In most years services debits will increase more than services credits.
5 Net changes to services credits (exports), current prices |
|
 | 1994-95 | 1995-96 | 1996-97 | 1997-98 | 1998-99 | 1999-2000 | 2000-01 | 2001-02 | 2002-03 | 2003-04 | 2004-05 | 2005-06 | 2006-07 | 2007-08 |
 | $m | $m | $m | $m | $m | $m | $m | $m | $m | $m | $m | $m | $m | $m |
|
| Services exports (BPM5) | 21 002 | 23 329 | 25 157 | 26 594 | 28 312 | 30 810 | 35 932 | 35 162 | 35 987 | 37 746 | 39 695 | 41 849 | 46 181 | 51 035 |
| Net change to Manufacturing services | 22 | 16 | 17 | 23 | 40 | 20 | 20 | 9 | 22 | 20 | 63 | 107 | 121 | 77 |
| Net change to Maintenance and repairs | 18 | 19 | 27 | 44 | 63 | 54 | 60 | 54 | 60 | 75 | 67 | 74 | 90 | 103 |
| Net change to Transport | 93 | 101 | 98 | -163 | -92 | 15 | 22 | 14 | -10 | -65 | -61 | -22 | -71 | -118 |
| Net change to Insurance and pension services | 47 | 56 | 59 | 83 | 95 | 104 | -39 | -203 | -215 | -266 | -293 | -374 | -391 | -376 |
| Net change to Financial services | 130 | 241 | 233 | 4 | -194 | -253 | -81 | -6 | 42 | -47 | -47 | 160 | 127 | 37 |
| Net change to Other changes | -242 | -271 | -344 | -46 | -186 | -296 | -206 | -242 | -165 | -152 | -135 | -153 | -101 | -113 |
| Services exports (BPM6) | 21 070 | 23 491 | 25 247 | 26 539 | 28 038 | 30 454 | 35 708 | 34 788 | 35 721 | 37 311 | 39 289 | 41 641 | 45 956 | 50 645 |
|
Figure 4 - Services credits (exports), BPM5 and BPM6 basis
- current prices
6 Net changes to services debits (imports), current prices |
|
 | 1994-95 | 1995-96 | 1996-97 | 1997-98 | 1998-99 | 1999-2000 | 2000-01 | 2001-02 | 2002-03 | 2003-04 | 2004-05 | 2005-06 | 2006-07 | 2007-08 |
 | $m | $m | $m | $m | $m | $m | $m | $m | $m | $m | $m | $m | $m | $m |
|
| Services imports (BPM5) | 22 579 | 23 678 | 24 570 | 27 162 | 29 089 | 30 579 | 33 801 | 33 135 | 33 463 | 35 696 | 39 315 | 41 078 | 44 428 | 52 250 |
| Net change to Manufacturing services | 4 | 9 | 8 | 15 | 24 | 29 | 22 | 11 | 14 | 15 | 9 | 5 | 3 | 7 |
| Net change to Maintenance and repairs | 32 | 35 | 63 | 76 | 112 | 95 | 168 | 242 | 251 | 219 | 171 | 115 | 131 | 97 |
| Net change to Transport | 424 | 406 | 494 | 655 | 656 | 605 | 239 | 284 | 328 | 360 | 306 | 330 | 372 | 417 |
| Net change to Insurance and pension services | 117 | 140 | 123 | 157 | 134 | 53 | -9 | -82 | -183 | -375 | -287 | -197 | -121 | 71 |
| Net change to Financial Services | 93 | 95 | 63 | -52 | -78 | -144 | -41 | 101 | 173 | 223 | 322 | 362 | 443 | 593 |
| Net change to Other changes | -126 | -75 | -70 | -102 | -83 | -112 | -89 | -135 | -124 | -177 | -133 | -174 | -117 | -105 |
| Services imports (BPM6) | 23 123 | 24 288 | 25 251 | 27 911 | 29 854 | 31 105 | 34 091 | 33 556 | 33 922 | 35 961 | 39 703 | 41 519 | 45 139 | 53 330 |
|
Figure 5 - Services debits (imports), BPM5 and BPM6 basis
- current prices
INCOME ACCOUNT
Income and current transfers will be replaced by primary income and secondary income, respectively.
PRIMARY INCOME
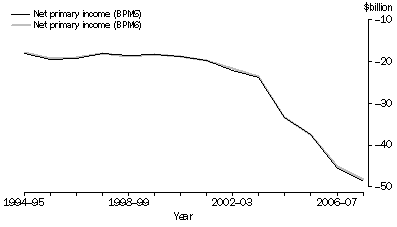
The changes to primary income will derive primarily from the inclusion of reinvested earnings on investment funds, detailed in chapter 9, together with new or revised models for insurance, pension funds and FISIM as detailed in chapters 10 to 12. Table 7 shows that net primary income will increase by about $350 million (-0.7%) in 2007-08.
7 Primary income, current prices |
|
 | 1994-95 | 1995-96 | 1996-97 | 1997-98 | 1998-99 | 1999-2000 | 2000-01 | 2001-02 | 2002-03 | 2003-04 | 2004-05 | 2005-06 | 2006-07 | 2007-08 |
| Primary income | $m | $m | $m | $m | $m | $m | $m | $m | $m | $m | $m | $m | $m | $m |
|
| Net primary income (BPM5) | -18 117 | -19 533 | -19 151 | -18 091 | -18 430 | -18 249 | -18 737 | -19 667 | -22 195 | -23 840 | -33 330 | -37 458 | -45 433 | -48 601 |
| Net changes to Reinvested Earnings | 305 | 180 | 54 | -124 | -436 | -198 | -141 | 15 | 411 | -10 | -150 | -232 | 146 | 205 |
| Net changes to FISIM | -56 | 5 | 22 | -7 | 19 | 23 | 113 | 42 | 21 | 53 | -31 | -85 | -95 | -76 |
| Net changes to pension income | 33 | 34 | 32 | 41 | 78 | 65 | 55 | 28 | 69 | 80 | 96 | 175 | 204 | 177 |
| Net changes to insurance income | -4 | -8 | -4 | -8 | -11 | -8 | -9 | -8 | -12 | -20 | -37 | -25 | -22 | -4 |
| Net changes to CoE | 9 | 11 | 13 | 15 | 18 | 22 | 25 | 25 | 31 | 36 | 38 | 48 | 61 | 45 |
| Net primary income (BPM6) | -17 830 | -19 311 | -19 034 | -18 174 | -18 762 | -18 345 | -18 694 | -19 565 | -21 675 | -23 701 | -33 414 | -37 577 | -45 139 | -48 254 |
|
Figure 6 - Net changes to primary income, current prices
SECONDARY INCOME
The term secondary income will be introduced with BPM6 with further dissection by type of transfers to be recorded as supplementary items. Changes to secondary income will be the result of:
- the workers' remittances item will be replaced with personal transfers, which is broader in scope, and workers' remittances becoming a supplementary item. Workers' remittances debits will be the only component of personal transfers currently measured and a new methodology will be introduced. An Information Paper : Estimation of Workers' Remittances based on Balance of Payments Manual & International Investment Position sixth Edition (cat.no. 5302.0.55.003) describing the new methodology was released on 14 August 2009;
- the other transfers item will be named other current transfers. This item has two components:
- non-life insurance transfers component which will be named non-life insurance premiums and claims and include the results of a revised methodology (see chapter 11)
- other revisions which will be introduced to the other component of other transfers including changes to social contributions and social benefits from the introduction of pensions into the international accounts (see chapter 10).
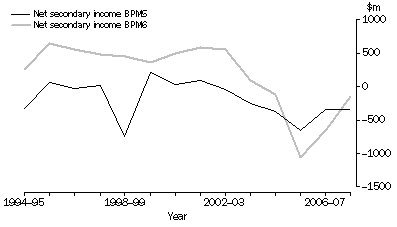
Net secondary income under BPM5 standards was -$342 million, under BPM6 this will increase to -$154 million (table 8).
8 Changes to secondary income, current prices |
|
 | 1994-95 | 1995-96 | 1996-97 | 1997-98 | 1998-99 | 1999-2000 | 2000-01 | 2001-02 | 2002-03 | 2003-04 | 2004-05 | 2005-06 | 2006-07 | 2007-08 |
 | $m | $m | $m | $m | $m | $m | $m | $m | $m | $m | $m | $m | $m | $m |
|
| Net secondary income (BPM5) | -323 | 64 | -21 | 22 | -749 | 218 | 32 | 90 | -45 | -255 | -369 | -649 | -339 | -342 |
| Net change to Net secondary income | 587 | 589 | 583 | 463 | 1 198 | 141 | 460 | 489 | 603 | 352 | 259 | -404 | -302 | 188 |
| Net secondary income (BPM6) | 264 | 653 | 562 | 485 | 449 | 359 | 492 | 579 | 558 | 97 | -110 | -1 053 | -641 | -154 |
| Secondary income credits(BPM5) | 3 024 | 3 292 | 3 540 | 3 993 | 4 498 | 4 625 | 4 453 | 4 381 | 4 297 | 4 191 | 4 268 | 4 602 | 5 155 | 5 264 |
| Net change to Secondary income credits | 782 | 810 | 2 164 | 1 923 | 1 598 | 1 437 | 1 240 | 795 | 910 | 701 | 685 | 619 | 671 | 794 |
| Secondary income credits(BPM6) | 3 806 | 4 102 | 5 704 | 5 916 | 6 096 | 6 062 | 5 693 | 5 176 | 5 207 | 4 892 | 4 953 | 5 221 | 5 826 | 6 058 |
| Secondary income debits (BPM5) | 3 347 | 3 228 | 3 561 | 3 971 | 5 247 | 4 407 | 4 421 | 4 291 | 4 342 | 4 446 | 4 637 | 5 251 | 5 494 | 5 606 |
| Net change to Secondary income debits | 195 | 221 | 1 581 | 1 460 | 400 | 1 296 | 780 | 306 | 307 | 349 | 426 | 1 023 | 973 | 606 |
| Secondary income debits (BPM6) | 3 542 | 3 449 | 5 142 | 5 431 | 5 647 | 5 703 | 5 201 | 4 597 | 4 649 | 4 795 | 5 063 | 6 274 | 6 467 | 6 212 |
|
Figure 7 - Net secondary income, BPM5 and BPM6 basis
- current prices
FINANCIAL ACCOUNT
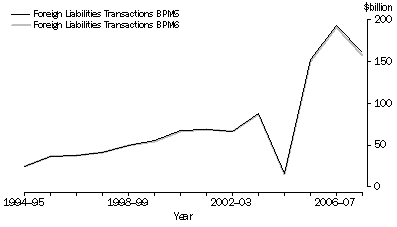
Table 9 summarises changes to the financial account as a result of:
- a new model for insurance technical reserves. Changes in insurance technical reserves due to changes in the prepayments of insurance premiums and changes in claims incurred but not yet paid will be captured as transactions in the financial account.;
- pension fund assets attributable to non-residents are explicitly modelled and changes due to contributions and the payment of benefits will be included in the financial account;
- reinvested earnings on investment funds will be explicitly modelled and included in transactions in the Financial account as an offset to the corresponding income in the primary income account; and
- a new model for the treatment of changes due to migration. When migrants become resident of a new country they are assumed to leave assets in their former country of residence. This establishes an international investment position. Assets that are progressively transferred to the new country of residence will be captured as transactions in the financial account. This will replace the migrants transfers item in the capital account.
Further details of these changes are provided in chapters 10,11 and 13. In addition, the financial account will be revised due to BPM6 presentation being on a gross basis (directional principle) and re-balancing of the accounts.
9 Transactions in the Financial Account |
| Transactions | 1994-95 | 1995-96 | 1996-97 | 1997-98 | 1998-99 | 1999-2000 | 2000-01 | 2001-02 | 2002-03 | 2003-04 | 2004-05 | 2005-06 | 2006-07 | 2007-08 |
 | $m | $m | $m | $m | $m | $m | $m | $m | $m | $m | $m | $m | $m | $m |
|
| Total Foreign Assets (BPM5) | -4 123 | 19 024 | 19 929 | 16 692 | 19 139 | 24 478 | 50 943 | 50 038 | 29 374 | 43 936 | -39 664 | 100 625 | 136 404 | 92 260 |
| Reinvested earnings | 470 | 424 | 304 | 287 | 98 | 299 | 372 | 610 | 840 | 673 | 580 | 580 | 1 005 | 980 |
| Insurance Assets | 45 | 14 | 104 | 178 | -17 | 8 | 65 | 48 | 82 | 83 | -96 | 44 | -79 | -137 |
| Pensions Assets | 287 | 324 | 359 | 535 | 640 | 628 | 351 | 300 | 451 | 602 | 725 | 1 263 | 1 131 | 528 |
| Changes to assets due to migration | -1 454 | -1 753 | -1 810 | -1 763 | -1 943 | -2 320 | -2 859 | -2 990 | -3 184 | -4 293 | -5 297 | -6 341 | -7 852 | -8 628 |
| Total Foreign Assets (BPM6) | -4 775 | 18 033 | 18 886 | 15 929 | 17 917 | 23 093 | 48 872 | 48 006 | 27 563 | 41 001 | -43 752 | 96 171 | 130 609 | 85 003 |
| Total Foreign Liabilities (BPM5) | 24 298 | 36 839 | 37 482 | 41 334 | 49 252 | 55 535 | 67 223 | 69 188 | 66 845 | 88 624 | 16 131 | 152 590 | 193 470 | 160 408 |
| Reinvested earnings | 165 | 244 | 250 | 411 | 534 | 497 | 513 | 595 | 429 | 683 | 730 | 812 | 860 | 775 |
| Insurance Liabilities | 60 | 193 | 141 | 149 | 50 | -54 | 75 | 197 | 60 | -77 | -155 | -490 | -350 | 1 |
| Pensions Liabilities | 81 | 76 | 96 | 138 | 238 | 244 | -29 | -119 | 9 | 149 | 199 | 623 | 475 | -296 |
| Changes to liabilities due to migration | -499 | -580 | -629 | -674 | -772 | -948 | -1 172 | -1 312 | -1 461 | -2 196 | -2 506 | -2 687 | -3 250 | -3 679 |
| Total Foreign Liabilities (BPM6) | 24 105 | 36 772 | 37 340 | 41 358 | 49 302 | 55 274 | 66 610 | 68 549 | 65 882 | 87 183 | 14 399 | 150 848 | 191 205 | 157 209 |
| Financial Account (BPM5) | 28 421 | 17 815 | 17 553 | 24 642 | 30 113 | 31 057 | 16 280 | 19 150 | 37 471 | 44 688 | 55 795 | 51 965 | 57 066 | 68 148 |
| Financial Account (BPM6) | 28 880 | 18 739 | 18 454 | 25 429 | 31 385 | 32 181 | 17 738 | 20 543 | 38 319 | 46 182 | 58 151 | 54 677 | 60 596 | 72 206 |
|
Both pension assets and changes in assets due to migration are highly correlated to migration estimates. Australia usually has higher numbers of permanent immigrants than residents departing permanently. This is particularly the case in 1997-98 and between 2004-05 and 2007-08 reflected in the increase in transactions for pension assets held and changes in assets due to migration over this period.
Figure 8 - Financial Account, BPM5 and BPM6 basis
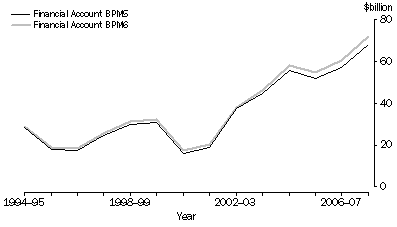
Figure 9 - Transactions in the Financial Account, Total Foreign Assets
- BPM5 and BPM6 basis
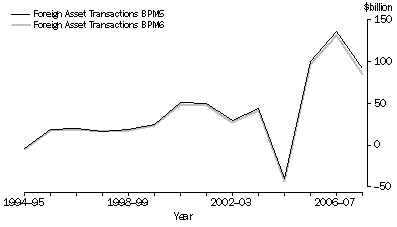
Figure 10 - Transactions in the Financial Account, Total Foreign Liabilities
- BPM5 and BPM6 basis
INTERNATIONAL INVESTMENT POSITION
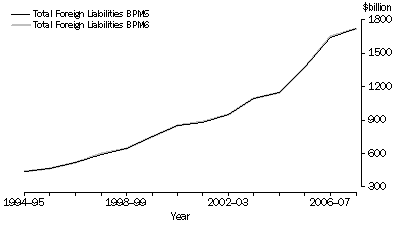
The changes as a result of BPM6 will decrease Australia's net international investment liability by about $13.8 billion (2%) at 30 June 2008. The changes were driven by the following:
- insurance technical reserves will now be explicitly modelled and included in the international investment position;
- pension fund assets attributable to non-residents will be explicitly modelled and included in the international investment position; and
- a new model for the treatment of changes due to migration. When migrants become resident of a new country they are assumed to leave assets in their former country of residence which will establishe an international investment position.
Further details are provided in chapters 10,11 and 13.
10 International Investment Position |
|
 | 1994-95 | 1995-96 | 1996-97 | 1997-98 | 1998-99 | 1999-2000 | 2000-01 | 2001-02 | 2002-03 | 2003-04 | 2004-05 | 2005-06 | 2006-07 | 2007-08 |
| Assets | $m | $m | $m | $m | $m | $m | $m | $m | $m | $m | $m | $m | $m | $m |
|
| Total Foreign Assets (BPM5) | 184 783 | 193 387 | 229 768 | 299 528 | 325 163 | 426 176 | 488 144 | 518 514 | 529 797 | 638 398 | 643 626 | 830 906 | 1 016 566 | 1 048 612 |
| Insurance Assets | 383 | 456 | 510 | 567 | 587 | 566 | 595 | 665 | 714 | 900 | 1 049 | 1 135 | 1 240 | 1 403 |
| Pension Assets | 1 590 | 1 919 | 2 200 | 3 186 | 3 482 | 3 548 | 3 701 | 4 089 | 5 105 | 6 829 | 9 146 | 12 664 | 14 491 | 12 276 |
| Changes to assets due to migration | 639 | 743 | 711 | 701 | 828 | 995 | 1 243 | 1 165 | 1 346 | 1 964 | 2 222 | 2 747 | 3 403 | 3 483 |
| Total Foreign Assets (BPM6) | 187 395 | 196 505 | 233 189 | 303 982 | 330 060 | 431 285 | 493 683 | 524 433 | 536 962 | 648 091 | 656 043 | 847 452 | 1 035 700 | 1 065 774 |
 |  |  |  |  |  |  |  |  |  |  |  |  |  |  |
| Total Foreign Liabilities (BPM5) | 440 293 | 468 698 | 519 924 | 596 466 | 646 818 | 754 946 | 853 701 | 883 695 | 945 701 | 1 091 724 | 1 150 064 | 1 372 779 | 1 644 695 | 1 724 482 |
| Insurance Liabilities | 1 001 | 1 194 | 1 335 | 1 484 | 1 534 | 1 480 | 1 555 | 1 752 | 1 812 | 1 735 | 1 580 | 1 090 | 740 | 741 |
| Pension Liabilities | 187 | 219 | 267 | 312 | 357 | 440 | 470 | 489 | 514 | 611 | 696 | 852 | 1 119 | 1 076 |
| Changes to liabilities due to migration | 211 | 246 | 256 | 279 | 329 | 413 | 506 | 537 | 616 | 1 053 | 969 | 1 145 | 1 403 | 1 517 |
| Total Foreign Liabilities (BPM6) | 441 692 | 470 357 | 521 782 | 598 541 | 649 038 | 757 279 | 856 232 | 886 473 | 948 643 | 1 095 123 | 1 153 309 | 1 375 866 | 1 647 957 | 1 727 816 |
 |  |  |  |  |  |  |  |  |  |  |  |  |  |  |
| Net International Investment Position (BPM5) | 255 510 | 275 311 | 290 156 | 296 938 | 321 655 | 328 770 | 365 557 | 365 181 | 415 904 | 453 326 | 506 438 | 541 873 | 628 129 | 675 870 |
| Net International Investment Position (BPM6) | 254 297 | 273 852 | 288 593 | 294 559 | 318 978 | 325 994 | 362 549 | 362 040 | 411 681 | 447 032 | 497 266 | 528 414 | 612 257 | 662 041 |
|
As is the case with the financial account, pension assets and changes in assets due to migration are highly correlated to migration estimates. Australia usually has higher numbers of permanent immigrants than residents departing permanently. This is particularly the case between 2004-05 and 2007-08 reflecting the increase in pension assets held and changes in assets due to migration over this period.
Figure 11 - Net International Investment Position, BPM5 and BPM6 basis
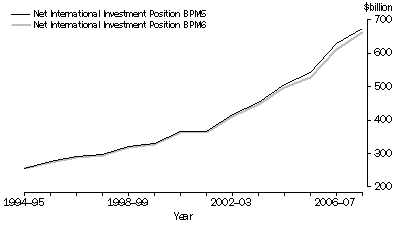
Figure 12 - Total Foreign Assets, BPM5 and BPM6 basis
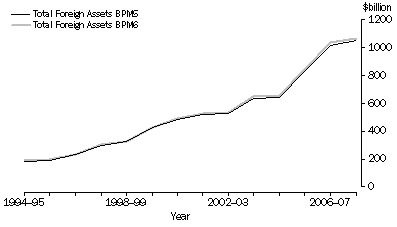
Figure 13 - Total Foreign Liabilities, BPM5 and BPM6 basis
 Print Page
 Print All