CONSUMER PRICE INDEX
- After two quarters of negative growth, Perth's Consumer Price Index (CPI) increased 0.8% in the June quarter 2009.
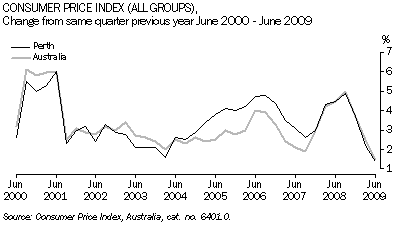
- In the year to June 2009, Perth's CPI rose 1.4%, the same percentage rise shown in the weighted average for the eight Australian capital cities. All the capital cities recorded rising prices, with Darwin the largest increase (2.5%) followed by Canberra (2.1%), while Melbourne had the smallest increase (1.2%).
- Since early 2008, the Perth CPI has been close to the weighted average for Australian capital cities, after 3 years of being considerably higher.
- Clothing and footwear (7%) was the most significant contributor to the June increase after a substantial decrease (-5.4%) in March 2009. Within this group, men's clothing, men's outerwear and accessories all rose between 11% and 13%.
- Another significant contributor to the price increase was Transportation (2.8%), particularly automotive fuel prices which increased by 7%, reversing the negative change in the last two quarters. Health costs (hospital and medical services up 4.8%) and household and content services (towels and linen up 12%) also drove the increase.
- In contrast, the June quarter saw price decreases in financial and insurance services (-1.7%) and recreation (-0.7%). Deposits and loan facilities (-4.4%) was again the main contributor to the decrease in the cost of financial and insurance services.
1 Consumer Price Index(a), by group - Perth |
|
 | Change from same quarter previous year | Change from previous quarter |
| Jun 09 | Jun 09 |
| % | % |
|
| All groups | 1.4 | 0.8 |
| Food | 3.7 | -0.3 |
| Alcohol and tobacco | 4.6 | 0.3 |
| Clothing and footwear | 0.1 | 7.0 |
| Housing | 5.1 | 1.0 |
| Household contents and services | 4.0 | 2.3 |
| Health | 5.9 | 2.4 |
| Transportation | -6.1 | 2.8 |
| Communication | 1.1 | 0.2 |
| Recreation | 0.1 | -0.7 |
| Education | 5.3 | - |
| Financial and insurance services(b) | -7.2 | -1.7 |
|
| - nil or rounded to zero (including null cells) |
| (a) Unless otherwise specified, base of each index: 1989-90 = 100.0. |
| (b) Base of index: June quarter 2005 = 100.0. |
| Source: Consumer Price Index, Australia, cat. no. 6401.0. |
- In the year to June 2009 the main contributors to Perth's CPI increase were Health, Education and Housing.
- The negative contributors over the year were Financial and insurance services and Transportation.
To view Excel Spreadsheet:
Consumer Price Index
 Print Page
 Print All