OWNERSHIP OF MOTOR VEHICLES
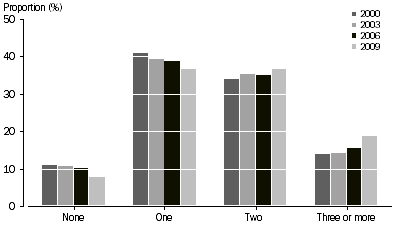
In March 2009, 92% of Australian households had one or more registered motor vehicle kept at home, compared with 89% in 2000. Western Australia had the highest proportion with 96% of households having one or more registered motor vehicles kept at home. Households with two or more registered motor vehicles were most common in Northern Territory (62%) and least common in New South Wales (51%) (table 3.3).
The proportion of households with no motor vehicle was greater in state capital cities than in the balance of state/territory (9% and 6% respectively). Households situated outside of state capital cities had a higher proportion of three or more registered motor vehicles than those in capital cities (21% compared to 17%) (table 3.2).
The number of registered motor vehicles kept by Australian households in the previous 12 months stayed the same for 87% of households, increased by at least one for 8% of households, and decreased by at least one for 5% of households (table 3.4).
Of the households with registered motor vehicles, 97% have a car, station wagon or 4WD passenger vehicle and 18% have a utility, panel van or truck. Households living outside of state capital cities had a higher percentage of utilities, panel vans or trucks than those living in state capital cities (27% and 13% respectively) (table 3.7).
Number of registered motor vehicles kept at home - 2000 to 2009
 Quality Declaration
  Print Page
 Print All