|
|
|
AVERAGE DWELLING COMPLETION TIMES
INTRODUCTION
This article examines the average completion times (in quarters) for new houses, townhouses and flats, units or apartments from 2006-2016.
Completion times are measured as the period (in quarters) between the commencement and completion of construction for a project creating new dwellings. National data is presented to show changes in the average completion times of new houses, townhouses and flats, units or apartments. Regional data is presented in five year periods to allow for broader comparisons between the states and territories.
The data presented is from the Australian Bureau of Statistics (ABS) quarterly publication Building Activity, Australia (cat. no. 8752.0). 'New houses' are defined as detached buildings used for long term residential purposes, consisting of only one dwelling unit and are not a result of alterations or additions to a pre-existing building. 'Townhouses' are dwellings with their own private grounds and no separate dwelling above or below. They are either attached in some structural way to one or more dwellings or are separated from neighbouring non-residential buildings by less than 500 millimetres. 'Flats, units or apartments' are blocks of dwellings that don't have their own private grounds and usually share a common entrance, foyer or stairwell. For further information refer to Functional Classification of Buildings, 1999 (Revision 2011) (cat. no. 1268.0.55.001).
For the data relating to houses and townhouses, dwellings that took more than three years to complete or were constructed in groups of 10 or more were excluded. As a result, approximately 2.5% of completed houses and townhouses were excluded.
RESULTS
Australian average quarterly completion times
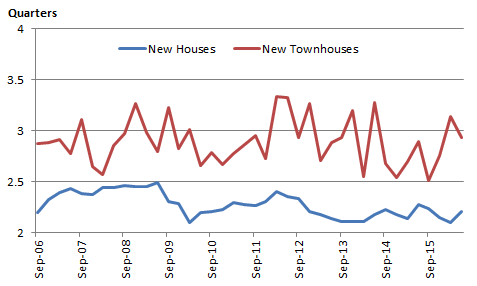
Graph 1 illustrates the Australian average completion times, in quarters, for new houses and townhouses from September quarter 2006 to June quarter 2016.
| The main difference between the two types of residential dwellings is that new houses had a lower average completion time than new townhouses. Over the 2006-2016 period, new houses had an average completion time of 2.27 quarters compared with an average completion time of 2.89 quarters for new townhouses. |
Average completion times for new houses remained fairly steady over the period, averaging between 2 and 2.5 quarters to complete. Average completion times for new townhouses were more volatile over the same period, varying between 2.5 and 3.4 quarters.
Graph 1: Average completion time of new houses and new townhouses, Australia
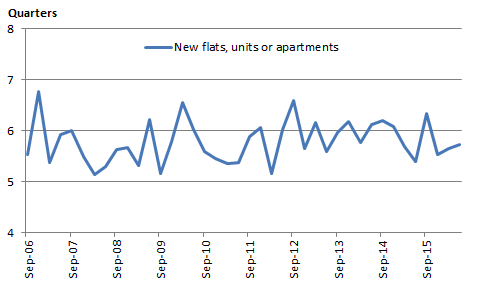
Graph 2 illustrates Australian average completion times, in quarters, for new flats, units or apartments from September quarter 2006 to June quarter 2016. Completion times for flats, units or apartments are substantially higher than new houses and townhouses.
Average completion times for new flats, units or apartments have also been relatively volatile, ranging from a low of 5.1 quarters to 6.8 quarters over the period.
Graph 2: Average completion time of new flats, units or apartments, Australia
 |
Average completion times for new houses
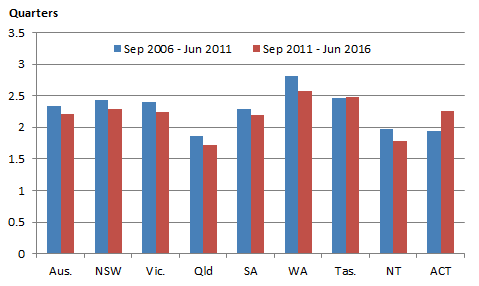
Graph 3 illustrates the five year average completion times for new houses over a 10 year period for Australia and the states and territories.
Average completion times for new houses declined in New South Wales, Victoria, Queensland, South Australia, Western Australia and Northern Territory in the 2011-2016 period compared to the 2006-2011 period. In contrast, Tasmania and Australian Capital Territory recorded a slight increase in average new house completion times. Western Australia recorded the largest decrease of 0.24 of a quarter, while the Australian Capital Territory recorded the largest increase of 0.32 of a quarter.
Graph 3: Completion time of new houses, five year averages, states, territories and Australia
Average completion times for new townhouses
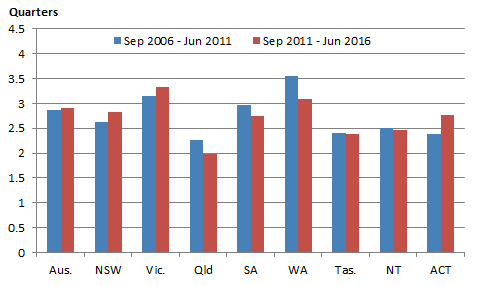
Graph 4 illustrates the five year average completion times for new townhouses over a 10 year period for Australia and the states and territories.
Australia, New South Wales, Victoria and the Australian Capital Territory all recorded increases in average completion times for new townhouses in the 2011-2016 period, compared to the 2006-2011 period. Queensland, South Australia, Western Australia, Tasmania and the Northern Territory all recorded decreases. The Australian Capital Territory recorded the biggest increase of 0.37 of a quarter, while Western Australia recorded the biggest decrease of 0.47 of a quarter.
Graph 4: Completion time of new townhouses, five year averages, states, territories and Australia
Average completion times for new flats, units or apartments
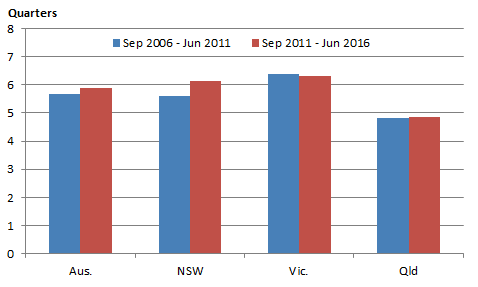
Graph 5 illustrates the five year average completion times for new flats, units or apartments over a 10 year period for Australia, New South Wales, Victoria and Queensland. These states account for the large majority of new flats, units or apartments under construction.
Average completion times between the two periods are fairly similar with New South Wales recording the biggest change with an increase of 0.51 of a quarter in the 2011-2016 period.
Graph 5: Completion time of new flats, units or apartments, five year averages, Australia, New South Wales, Victoria and Queensland
 |
|
|
 Print Page
 Print All
 Quality Declaration