MAIN CONTRIBUTORS TO CHANGE
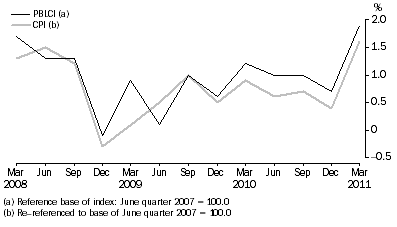
The PBLCI increased 1.9% for the March quarter 2011. Food (+3.3%) made the greatest contribution to the quarterly rise primarily due to increases in fruit and vegetables following the floods and Cyclone Yasi. Increases were also recorded in transportation (+3.6%) primarily due to automotive fuel, housing (+1.7%) due to rises in electricity and rents, and health (+6.7%) due to the cyclical reduction in the proportion of consumers who qualify for subsidised pharmaceuticals and out-of-hospital medical expenses at the start of each calendar year.
The most significant offsets were provided by household contents and services (-1.3%), clothing and footwear (-1.1%) and recreation (-0.6%) primarily due to falls in furniture, children's footwear and audio, visual and computing equipment respectively.
The major contributors to the difference between the PBLCI (+1.9%) and the CPI (+1.6%) in the March quarter 2011 were automotive fuel, vegetables, pharmaceuticals, fruit, electricity, and rents. PBLCI households have a relatively higher proportion of expenditure attributed to each of these commodities compared to the wider CPI population group.
GRAPHS
Pensioner and Beneficiary Living Cost Index and CPI, All groups
- Percentage change from previous quarter

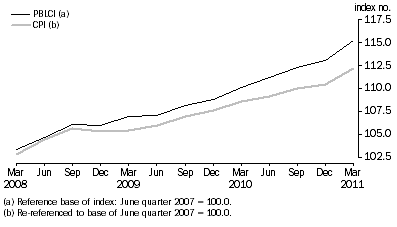
Comparison of PBLCI and CPI Indexes

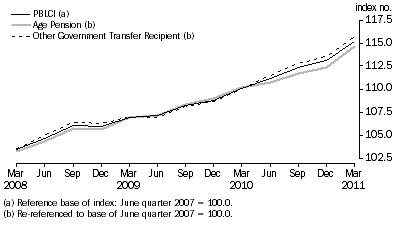
Comparison of PBLCI and selected Analytical Living Cost Indexes

Table 1: Pensioner and Beneficiary Living Cost Index, All Groups, Weighted average of eight capital cities - index numbers, percentage change and points change |
|
 |  |  | Percentage change | Points change |
| Quarters | Index Numbers(a) | From previous quarter | From corresponding quarter of previous year | From previous quarter | From corresponding quarter of previous year |
|
| 2008 |  |  |  |  |  |
 | September | 106.1 | 1.3 | 5.2 | 1.4 | 5.2 |
 | December | 106.0 | -0.1 | 4.2 | -0.1 | 4.3 |
| 2009 |  |  |  |  |  |
 | March | 107.0 | 0.9 | 3.5 | 1.0 | 3.6 |
 | June | 107.1 | 0.1 | 2.3 | 0.1 | 2.4 |
 | September | 108.2 | 1.0 | 1.9 | 1.1 | 2.1 |
 | December | 108.8 | 0.6 | 2.7 | 0.6 | 2.8 |
| 2010 |  |  |  |  |  |
 | March | 110.1 | 1.2 | 2.9 | 1.3 | 3.1 |
 | June | 111.2 | 1.0 | 3.8 | 1.1 | 4.1 |
 | September | 112.3 | 1.0 | 3.8 | 1.1 | 4.1 |
 | December | 113.1 | 0.7 | 4.0 | 0.8 | 4.3 |
| 2011 |  |  |  |  |  |
 | March | 115.2 | 1.9 | 4.6 | 2.1 | 5.1 |
|
| (a) Reference base of index: June quarter 2007 = 100.0 |
Table 2: Percentage change in analytical living cost indexes, PBLCI and CPI, by commodity group - December Quarter 2010 to March Quarter 2011 |
|
| Commodity group | Age pensioner ALCI(a) | Other government transfer recipient ALCI(a) | PBLCI | CPI(b) |
|
| Food | 3.6 | 3.1 | 3.3 | 2.9 |
| Alcohol and tobacco | 1.0 | 1.5 | 1.3 | 1.1 |
| Clothing and footwear | -1.2 | -1.3 | -1.1 | -0.7 |
| Housing(c) | 1.7 | 1.6 | 1.7 | 1.3 |
| Household contents and services | -1.2 | -1.4 | -1.3 | -1.6 |
| Health | 6.4 | 7.2 | 6.7 | 3.9 |
| Transportation | 3.4 | 3.7 | 3.6 | 2.7 |
| Communication | 0.1 | 0.2 | 0.1 | 0.1 |
| Recreation | -0.6 | -0.6 | -0.6 | -0.6 |
| Education | 5.7 | 5.4 | 5.5 | 5.7 |
| Financial and insurance services(d) | 2.1 | 2.6 | 2.4 | 2.6 |
| All groups | 2.0 | 1.7 | 1.9 | 1.6 |
|
| (a) As published in Analytical Living Cost Indexes for Selected Australian Household Types (cat. no. 6463.0) |
| (b) As published in Consumer Price Index, Australia (cat. no. 6401.0) |
| (c) House purchases are included in the CPI but excluded from the population subgroup indexes. |
| (d) Includes interest charges and general insurance, except for the CPI. Interest charges are excluded from the CPI and general insurance is calculated on a different basis. |
Table 3: Points contribution to quarterly change, index points - December Quarter 2010 to March Quarter 2011 |
|
| Commodity group | Age pensioner ALCI(a) | Other government transfer recipient ALCI(a) | PBLCI(b) | CPI(a) |
|
| Food | 0.89 | 0.68 | 0.77 | 0.53 |
| Alcohol and tobacco | 0.08 | 0.18 | 0.15 | 0.08 |
| Clothing and footwear | -0.05 | -0.06 | -0.06 | -0.03 |
| Housing(c) | 0.37 | 0.41 | 0.39 | 0.30 |
| Household contents and services | -0.12 | -0.16 | -0.14 | -0.15 |
| Health | 0.52 | 0.25 | 0.37 | 0.22 |
| Transportation | 0.41 | 0.43 | 0.43 | 0.36 |
| Communication | 0.00 | 0.00 | 0.01 | 0.01 |
| Recreation | -0.06 | -0.06 | -0.06 | -0.06 |
| Education | 0.02 | 0.13 | 0.07 | 0.19 |
| Financial and insurance services(d) | 0.13 | 0.19 | 0.17 | 0.25 |
| All groups | 2.2 | 2.0 | 2.1 | 1.7 |
|
| (a) Re-referenced to base of June quarter 2007 = 100.0 |
| (b) Reference base of index: June quarter 2007 = 100.0 |
| (c) House purchases are included in the CPI but excluded from the population subgroup indexes. |
| (d) Includes interest charges and general insurance, except for the CPI. Interest charges are excluded from the CPI and general insurance is calculated on a different basis. |
Table 4: Contribution to total index, by commodity group, index points - December Quarter 2010 to March Quarter 2011 |
|
 | Age pensioner ALCI(a) | Other government transfer recipient ALCI(a) | PBLCI(b) | CPI(a) |
| Commodity group | Dec Qtr 2010 | Mar Qtr 2011 | Dec Qtr 2010 | Mar Qtr 2011 | Dec Qtr 2010 | Mar Qtr 2011 | Dec Qtr 2010 | Mar Qtr 2011 |
|
| Food | 24.42 | 25.31 | 21.90 | 22.58 | 22.97 | 23.74 | 18.07 | 18.60 |
| Alcohol and tobacco | 8.78 | 8.86 | 13.05 | 13.23 | 11.25 | 11.40 | 8.47 | 8.55 |
| Clothing and footwear | 4.61 | 4.56 | 4.35 | 4.29 | 4.46 | 4.40 | 3.58 | 3.55 |
| Housing(c) | 21.66 | 22.03 | 24.68 | 25.09 | 23.41 | 23.80 | 23.96 | 24.26 |
| Household contents and services | 11.32 | 11.20 | 10.37 | 10.21 | 10.77 | 10.63 | 9.58 | 9.43 |
| Health | 8.15 | 8.67 | 3.49 | 3.74 | 5.45 | 5.82 | 5.47 | 5.69 |
| Transportation | 12.09 | 12.50 | 11.66 | 12.09 | 11.84 | 12.27 | 13.77 | 14.13 |
| Communication | 3.73 | 3.73 | 4.35 | 4.35 | 4.08 | 4.09 | 3.16 | 3.17 |
| Recreation | 11.31 | 11.25 | 9.84 | 9.78 | 10.46 | 10.40 | 11.44 | 11.38 |
| Education | 0.18 | 0.20 | 2.15 | 2.28 | 1.33 | 1.40 | 3.29 | 3.48 |
| Financial and insurance services(d) | 6.15 | 6.28 | 7.76 | 7.95 | 7.08 | 7.25 | 9.71 | 9.96 |
| All groups | 112.4 | 114.6 | 113.6 | 115.6 | 113.1 | 115.2 | 110.5 | 112.2 |
|
| (a) Re-referenced to base of June quarter 2007 = 100.0 |
| (b) Reference base of index: June quarter 2007 = 100.0 |
| (c) House purchases are included in the CPI but excluded from the population subgroup indexes. |
| (d) Includes interest charges and general insurance, except for the CPI. Interest charges are excluded from the CPI and general insurance is calculated on a different basis. |
Table 5: Percentage change in analytical living cost indexes, PBLCI and CPI, Commodity group - March Quarter 2010 to March Quarter 2011 |
|
| Commodity group | Age pensioner ALCI(a) | Other government transfer recipient ALCI(a) | PBLCI | CPI(b) |
|
| Food | 5.1 | 4.3 | 4.7 | 4.3 |
| Alcohol and tobacco | 10.9 | 17.1 | 15.1 | 11.2 |
| Clothing and footwear | -1.9 | -1.7 | -1.7 | -1.3 |
| Housing(c) | 6.3 | 5.9 | 6.1 | 4.8 |
| Household contents and services | -0.3 | -0.5 | -0.5 | -0.5 |
| Health | 3.8 | 3.3 | 3.6 | 4.1 |
| Transportation | 3.9 | 4.5 | 4.3 | 3.0 |
| Communication | 0.2 | -0.1 | 0.0 | -0.2 |
| Recreation | -1.0 | -1.6 | -1.3 | -1.5 |
| Education | 5.8 | 5.5 | 5.6 | 5.9 |
| Financial and insurance services(d) | 7.0 | 12.0 | 10.1 | 2.8 |
| All groups | 4.1 | 5.1 | 4.6 | 3.3 |
|
| (a) As published in Analytical Living Cost Indexes for Selected Australian Household Types (cat. no. 6463.0) |
| (b) As published in Consumer Price Index, Australia (cat. no. 6401.0) |
| (c) House purchases are included in the CPI but excluded from the population subgroup indexes. |
| (d) Includes interest charges and general insurance, except for the CPI. Interest charges are excluded from the CPI and general insurance is calculated on a different basis. |
Table 6: Points contribution to annual change, index points - March Quarter 2010 to March Quarter 2011 |
|
| Commodity group | Age pensioner ALCI(a) | Other government transfer recipient ALCI(a) | PBLCI(b) | CPI(a) |
|
| Food | 1.20 | 0.90 | 1.07 | 0.79 |
| Alcohol and tobacco | 0.90 | 1.90 | 1.49 | 0.86 |
| Clothing and footwear | -0.10 | -0.10 | -0.08 | -0.04 |
| Housing(c) | 1.30 | 1.40 | 1.37 | 1.11 |
| Household contents and services | 0.00 | -0.10 | -0.04 | -0.04 |
| Health | 0.30 | 0.10 | 0.21 | 0.23 |
| Transportation | 0.50 | 0.50 | 0.51 | 0.42 |
| Communication | 0.00 | 0.00 | 0.00 | 0.00 |
| Recreation | -0.10 | -0.20 | -0.14 | -0.17 |
| Education | 0.00 | 0.10 | 0.08 | 0.20 |
| Financial and insurance services(d) | 0.40 | 0.80 | 0.67 | 0.27 |
| All groups | 4.4 | 5.6 | 5.1 | 3.6 |
|
| (a) Re-referenced to base of June quarter 2007 = 100.0 |
| (b) Reference base of index: June quarter 2007 = 100.0 |
| (c) House purchases are included in the CPI but excluded from the population subgroup indexes |
| (d) Includes interest charges and general insurance, except for the CPI. Interest charges are excluded from the CPI and general insurance is calculated on a different basis. |
Table 7: Contribution to total index, Commodity group, index points - March Quarter 2010 to March Quarter 2011 |
|
 | Age pensioner ALCI(a) | Other government transfer recipient ALCI(a) | PBLCI(b) | CPI(a) |
| Commodity group | Mar Qtr 2010 | Mar Qtr 2011 | Mar Qtr 2010 | Mar Qtr 2011 | Mar Qtr 2010 | Mar Qtr 2011 | Mar Qtr 2010 | Mar Qtr 2011 |
|
| Food | 24.08 | 25.31 | 21.64 | 22.58 | 22.67 | 23.74 | 17.81 | 18.60 |
| Alcohol and tobacco | 8.00 | 8.86 | 11.30 | 13.23 | 9.91 | 11.40 | 7.69 | 8.55 |
| Clothing and footwear | 4.64 | 4.56 | 4.36 | 4.29 | 4.48 | 4.40 | 3.59 | 3.55 |
| Housing(c) | 20.71 | 22.03 | 23.68 | 25.09 | 22.43 | 23.80 | 23.15 | 24.26 |
| Household contents and services | 11.22 | 11.20 | 10.27 | 10.21 | 10.67 | 10.63 | 9.47 | 9.43 |
| Health | 8.35 | 8.67 | 3.62 | 3.74 | 5.61 | 5.82 | 5.46 | 5.69 |
| Transportation | 12.02 | 12.50 | 11.57 | 12.09 | 11.76 | 12.27 | 13.71 | 14.13 |
| Communication | 3.72 | 3.73 | 4.35 | 4.35 | 4.09 | 4.09 | 3.17 | 3.17 |
| Recreation | 11.37 | 11.25 | 9.93 | 9.78 | 10.54 | 10.40 | 11.55 | 11.38 |
| Education | 0.18 | 0.20 | 2.15 | 2.28 | 1.32 | 1.40 | 3.28 | 3.48 |
| Financial and insurance services(d) | 5.87 | 6.28 | 7.11 | 7.95 | 6.58 | 7.25 | 9.69 | 9.96 |
| All groups | 110.2 | 114.6 | 110.0 | 115.6 | 110.1 | 115.2 | 108.6 | 112.2 |
|
| (a) Re-referenced to base of June quarter 2007 = 100.0 |
| (b) Reference base of index: June quarter 2007 = 100.0 |
| (c) House purchases are included in the CPI but excluded from the population subgroup indexes. |
| (d) Includes interest charges and general insurance, except for the CPI. Interest charges are excluded from the CPI and general insurance is calculated on a different basis. |
 Print Page
 Print All
 Quality Declaration