6416.0 - Residential Property Price Indexes: Eight Capital Cities, Sep 2015  Quality Declaration
Quality Declaration ARCHIVED ISSUE Released at 11:30 AM (CANBERRA TIME) 15/12/2015
Page tools:
 Print Page Print Page
 Print All Print All
| ||||||||||||||||||||||||||||||||||||||||||||||||||||||||||||||||||
ANALYSIS INDEX ANALYSIS
Notes The discussion of individual cities is ordered in terms of their significance to the change in the RPPI for the latest quarter. Weighted average of the eight capital cities (+2.0% RPPI) The RPPI for the weighted average of the eight capital cities rose 2.0% in the September quarter 2015. This follows a rise of 4.7% in the June quarter and a rise of 1.6% in the March quarter 2015. The RPPI rose 10.7% through the year to the September quarter 2015. In the September quarter 2015 the HPI rose 2.2% and the ADPI rose 1.6%. Through the year to the September quarter 2015, the HPI rose 11.4%, the largest through the year rise since the June quarter 2010. The ADPI rose 8.7%. The quarterly HPI result follows rises in the June quarter 2015 of 5.0% and a rise of 1.7% in the March quarter 2015. The ADPI result follows rises of 4.1% in the June quarter 2015 and 0.8% in the March quarter 2015. Sydney (+3.1% RPPI) The RPPI for Sydney rose 3.1% in the September quarter 2015. This follows rises in the June 2015 (+8.9%) and March 2015 (+3.1%) quarters. The index rose 19.9% through the year to the September quarter 2015. Over the September quarter 2015 the HPI rose 3.3%, this follows the June quarter rise of 9.8%, the largest quarterly rise since the start of the current series which commenced in the March quarter 2002. The ADPI rose 2.5%. For established houses, the rise in Sydney was broad based, with almost all segments of the market showing price rises. Strata with prices between $750,000 and $1.5m contributed most to the rise. Through the year to the September quarter 2015, the HPI rose 21.9%, the largest through the year rise since the start of the current series which commenced in the March quarter 2002. For attached dwellings, the rise in Sydney was seen across all segments of the market. Strata with prices between $650,000 and $1m contributed most to the rise. Through the year to the September quarter 2015, the ADPI rose 15.8%, the largest through the year rise since the start of the series which commenced in the September quarter 2003. Melbourne (+2.9% RPPI) The RPPI for Melbourne rose 2.9% in the September quarter 2015. This follows rises in the June 2015 (+4.2%) and March 2015 (+0.6%) quarters. The index rose 9.9% through the year to the September quarter 2015. Over the September quarter 2015 the HPI rose 3.2% and the ADPI rose 1.6%. For established houses, the rise in Melbourne was broad based, with almost all segments of the market showing price rises. Strata with prices between $450,000 and $1m contributed most to the rise. Through the year to the September quarter 2015, the HPI rose 11.5%. For attached dwellings, the rise in Melbourne was seen across most segments of the market. Strata with prices between $450,000 to $600,000 contributed most to the rise. Through the year to the September quarter 2015, the ADPI rose 4.5%. Brisbane (+1.3% RPPI) The RPPI for Brisbane rose 1.3% in the September quarter 2015. This follows rises in the June 2015 (+0.9%) and March 2015 (+0.4%) quarters. The index rose 3.8% through the year to the September quarter 2015. Over the September quarter 2015 the HPI rose 1.7% and the ADPI rose 0.2%. Through the year to the September quarter 2015, the HPI rose 4.5% and the ADPI rose 0.8%. Adelaide (+1.2% RPPI) The RPPI for Adelaide rose 1.2% in the September quarter 2015. This follows rises in the June 2015 (+0.5%) and March 2015 (+0.7%) quarters. The index rose 3.5% through the year to the September quarter 2015. Over the September quarter 2015 the HPI rose 1.3% and the ADPI rose 1.3%. Through the year to the September quarter 2015, the HPI rose 3.8% and the ADPI rose 2.3%. Canberra (+1.3% RPPI) The RPPI for Canberra rose 1.3% in the September quarter 2015. This follows rises in the June 2015 (+0.8%) and March 2015 (+1.1%) quarters. The index rose 4.0% through the year to the September quarter 2015. Over the September quarter 2015 the HPI rose 1.8% and the ADPI fell 0.6%. Through the year to the September quarter 2015, the HPI rose 5.5% and the ADPI fell 0.9%. Hobart (+0.5% RPPI) The RPPI for Hobart rose 0.5% in the September quarter 2015. This follows a flat result in the June quarter 2015 (0.0%) and a rise in the March quarter 2015 (+0.5%). The index rose 1.7% through the year to the September quarter 2015. Over the September quarter 2015 the HPI rose 0.4% and the ADPI rose 1.2%. Through the year to the September quarter 2015, the HPI rose 1.9% and the ADPI rose 0.9%. Perth (-2.4% RPPI) The RPPI for Perth fell 2.4% in the September quarter 2015. This follows falls in the June 2015 (-0.9%) and March 2015 (-0.1%) quarters. The index fell 3.3% through the year to the September quarter 2015. Over the September quarter 2015 the HPI fell 2.5% and the ADPI fell 2.1%. Through the year to the September quarter 2015, the HPI fell 3.4% and the ADPI fell 3.2%. Darwin (-0.4% RPPI) The RPPI for Darwin fell 0.4% in the September quarter 2015. This follows falls in the June 2015 (-0.8%) and March 2015 (-0.2%) quarters. The index fell 2.0% through the year to the September quarter 2015. Over the September quarter 2015 the HPI fell 0.4% and the ADPI fell 0.7%. Through the year to the September quarter 2015, the HPI fell 1.7% and the ADPI fell 2.8%. TOTAL VALUE OF THE DWELLING STOCK Quarterly Analysis 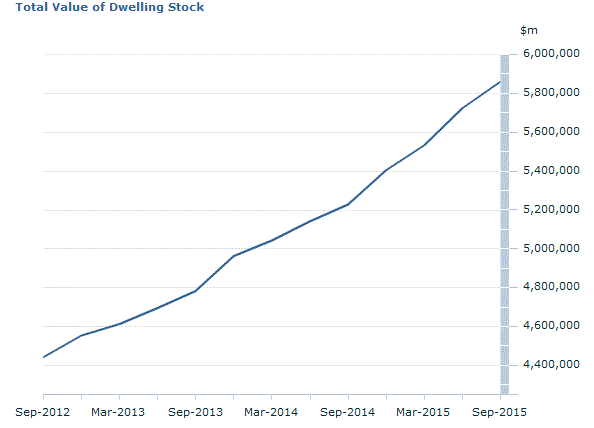 Source(s): Total Value of Dwelling Stock-RPPI_TVDS The preliminary estimate of the total value of residential dwellings in Australia in the September quarter 2015 was $5,859.8b (up from $5,722.7b in the June quarter 2015). Of this, $5,560.3b was owned by households. Over the same period, the number of residential dwellings rose by 38,600 to 9,572,400. The mean price of residential dwellings rose $11,900 to $612,200.
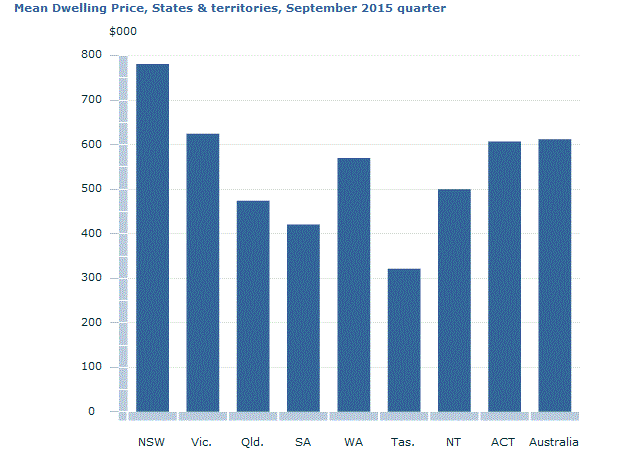 Source(s): Mean Dwelling Price, States and territories, September 2015 quarter-RPPI_MeanDwellingPrice The mean price of residential dwellings in NSW ($780,900) remains the highest in the country followed by Victoria ($624,500). The mean price in ACT ($607,100) is the third highest mean price. The lowest mean price is in Tasmania ($321,100). Document Selection These documents will be presented in a new window.
|
||||||||||||||||||||||||||||||||||||||||||||||||||||||||||||||||||
