ASSESSING VOLATILITY IN THE LABOUR FORCE SERIES
INTRODUCTION
Over the last 18 months the ABS has been implementing the Labour Force Survey change program. The questionnaire has been modified and the supplementary surveys program has been combined. This article assesses the level of volatility during the period of the Labour Force change program implementation and makes comparisons with the historical labour force series.
From July to September 2014 there was a high level of volatility in the Labour Force estimates. These results were the subject of an independent review (McCarthy Review). The Review concluded that the volatility was largely due to changes made to the supplementary survey program. The 'Supplementary Survey' effect was subsequently removed from the the seasonally adjusted series in October 2014. A revised set of estimates were published in the October issue of 6202.0.
The volatility assessment was undertaken by the ABS using estimates from the beginning of the series in February 1978 up to and including March 2015. To better assess how level of volatility has changed over time this analysis has been undertaken using 12 month rolling windows rather than looking at individual month to month movements. The methods used in the analysis have drawn on similar methods undertaken by StatsCanada and the resulting conclusions have been reviewed and validated by Professor Rob Hyndman from Monash University.
The volatility assessment found, for key national seasonally adjusted estimates (employed persons, unemployed persons and the unemployment rate), the current level of volatility, following the revisions published in the October 2014 issue of 6202.0, is below historical averages. While this analysis demonstrates that the current level of volatility is below historical averages, the ABS will continue to work on developing methods to improve the quality and coherence of published labour market information.
ASSESSMENT OF VOLATILITY
The volatility assessment considered:
- Variation in the month-to-month change in the seasonally adjusted series - the standard deviations of monthly changes in the series were produced for 12 month rolling windows.
- The difference each month between the seasonally adjusted and trend series - the standard deviations of the percentage difference between the seasonally adjusted and trend estimates were produced for 12 month rolling windows.
- The difference each month between the original and trend series - the standard deviations of the percentage difference between the original and trend estimates were produce for 12 month rolling windows.
In addition, an outlier analysis was conducted for each of these three measures of volatility by identifying extreme changes or observations that fall outside an approximate 95 per cent confidence interval.
The level of volatility was assessed at the national and state levels by males and females, for the number employed (total, full-time and part-time), number unemployed and the unemployment rate. (The details of which are in the full report). The assessment concluded that for national estimates in seasonally adjusted terms:
- for employed persons the current level of volatility has been below the historical average for more than a decade,
- for unemployed persons and the unemployment rate, the levels of volatility have dropped below their respective historical averages in the most recent years, following increased volatility around the time of the global financial crisis.
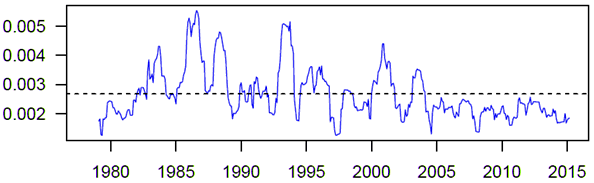
The Australia total employed chart presents the 12-month rolling window standard deviation of the percentage monthly change in the number of employed persons in Australia. The dotted line represents the average standard deviation over the time series. The solid line remaining below the dotted line demonstrates the lower level of volatility over the last ten years.
12-month Moving Average Standard Deviation of Monthly % Change Australia Employed Persons Total Seasonally Adjusted
The full report, which also includes consideration of the volatility of major State estimates, is available on request by emailing labourforce@abs.gov.au.
 Quality Declaration
  Print Page
 Print All