ANALYSIS AND COMMENTS
BALANCE ON GOODS AND SERVICES
The trend estimate of the balance on goods and services in August 2007 was a deficit of $1,412m, an increase of $44m on the deficit in July.
In seasonally adjusted terms, the balance on goods and services in August 2007 was a deficit of $1,614m, an increase of $731m on the deficit in July.
EXPORTS OF GOODS AND SERVICES
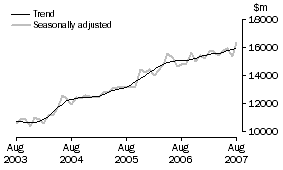
The trend estimate of goods and services credits rose $48m between July and August to $18,375m.
In seasonally adjusted terms, goods and services credits rose $321m (2%) to $18,638m. Non-rural goods rose $285m (3%) and other goods rose $87m (8%) while rural goods fell $73m (4%). Services credits rose $24m (1%).
Exports of goods
GOODS CREDITS

RURAL GOODS
The trend estimate of rural goods exports fell $24m (1%) to $1,851m.
In seasonally adjusted terms, exports of rural goods fell $73m (4%) to $1,848m.
The components contributing to the fall in the seasonally adjusted series were:
- cereal grains and cereal preparations, down $151m (40%)
- wool and sheepskins, down $12m (5%).
Partly offsetting these effects were:
- other rural, up $58m (7%)
- meat and meat preparations, up $31m (6%).
In original terms, exports of rural goods fell $22m (1%) to $1,878m.
NON-RURAL GOODS
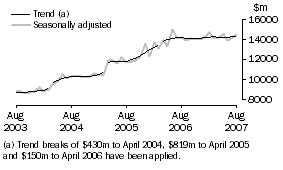
The trend estimate of non-rural goods exports rose $26m to $11,184m.
In seasonally adjusted terms, exports of non-rural goods rose $285m (3%) to $11,436m.
The main components contributing to the rise in the seasonally adjusted series were:
- other mineral fuels, up $301m (26%)
- metal ores and minerals, up $110m (4%)
- coal, coke and briquettes, up $72m (4%).
Partly offsetting these effects were:
- other non-rural, down $93m (7%)
- metals (excluding non-monetary gold), down $90m (7%)
- transport equipment, down $26m (5%).
In original terms, exports of non-rural goods rose $307m (3%) to $11,738m.
OTHER GOODS
The trend estimate of other goods exports rose $20m (2%) to $1,248m.
In seasonally adjusted terms, exports of other goods rose $87m (8%) to $1,247m.
The component contributing to the rise in the seasonally adjusted series was non-monetary gold, up $95m (9%).
In original terms, exports of other goods rose $94m (8%) to $1,253m.
Exports of services
SERVICES CREDITS

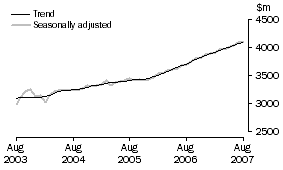
In trend terms, services credits rose $26m (1%) to $4,092m.
Seasonally adjusted, services credits rose $24m (1%) to $4,108m.
The components that contributed to the rise in the seasonally adjusted estimates were:
- other services, up $16m (1%)
- travel services, up $15m (1%).
Partly offsetting these effects was the transportation services component, down $8m (1%).
Seasonally adjusted, tourism related services credits rose $18m (1%) to $2,614m. This series is seasonally adjusted independently to the series that comprise services credits.
IMPORTS OF GOODS AND SERVICES
The trend estimate of goods and services debits rose $92m between July and August to $19,787m.
In seasonally adjusted terms, goods and services debits rose $1,052m (5%) to $20,252m. Capital goods rose $440m (14%), intermediate and other merchandise goods rose $409m (6%), consumption goods rose $139m (3%) and other goods rose $50m (6%). Services debits rose $14m.
Imports of goods
GOODS DEBITS

CONSUMPTION GOODS
The trend estimate of imports of consumption goods fell $11m to $4,584m.
In seasonally adjusted terms, imports of consumption goods rose $139m (3%) to $4,698m.
The main components contributing to the rise in the seasonally adjusted estimates were:
- non-industrial transport equipment, up $103m (9%)
- food and beverages, mainly for consumption, up $43m (7%)
- textiles, clothing and footwear, up $13m (2%).
Partly offsetting these effects was the consumption goods n.e.s. component, down $22m (2%).
In original terms, imports of consumption goods rose $424m (9%) to $5,068m.
CAPITAL GOODS
The trend estimate of imports of capital goods fell $4m to $3,490m.
In seasonally adjusted terms, imports of capital goods rose $440m (14%) to $3,647m.
The main components contributing to the rise in the seasonally adjusted estimates were:
- civil aircraft, up $289m
- industrial transport equipment n.e.s., up $79m (16%)
- ADP equipment, up $61m (11%)
- telecommunications equipment, up $14m (3%).
In original terms, imports of capital goods rose $530m (16%) to $3,778m.
INTERMEDIATE AND OTHER MERCHANDISE GOODS
The trend estimate of imports of intermediate and other merchandise goods rose $21m to $6,961m.
In seasonally adjusted terms, imports of intermediate and other merchandise goods rose $409m (6%) to $7,119m.
The main components contributing to the rise in the seasonally adjusted estimates were:
- fuels and lubricants, up $403m (22%), driven by crude petroleum, up $218m (19%), and other petroleum products, up $106m (22%)
- parts for transport equipment, up $71m (10%)
- other merchandise goods, up $32m (37%).
Partly offsetting these effects were:
- primary industrial supplies n.e.s., down $67m (41%)
- iron and steel, down $30m (9%).
In original terms, imports of intermediate and other merchandise goods rose $681m (10%) to $7,405m.
OTHER GOODS
The trend estimate of imports of other goods rose $63m (8%) to $873m.
In both original and seasonally adjusted terms, other goods debits rose $50m (6%) to $899m.
The components contributing to the rise in both original and seasonally adjusted estimates were:
- non-monetary gold, up $35m (5%)
- goods for processing, up $12m
- repairs on goods, up $3m (21%).
Imports of services
SERVICES DEBITS

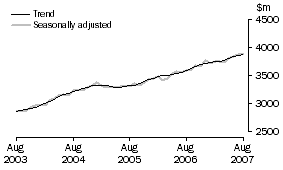
In trend terms, services debits rose $23m (1%) to $3,879m.
Seasonally adjusted, services debits rose $14m to $3,889m.
The main component contributing to the rise in the seasonally adjusted estimates was other services, up $18m (2%).
Seasonally adjusted, tourism related services debits rose $3m to $1,993m. This series is seasonally adjusted independently to the series that comprise services debits.
 Print Page
 Print All