SUMMARY COMMENTARY
INTRODUCTION
The importance of voluntary work to national life is increasingly being recognised. Most states and territories are encouraging engagement in voluntary work in their strategic plans for social development. Voluntary work meets needs, expands opportunities for democratic participation, personal development and recreation within a community and helps to develop and reinforce social networks and cohesion. In the Voluntary Work Survey a volunteer was defined as someone who, in the previous 12 months, willingly gave unpaid help, in the form of time, service or skills, through an organisation or group.
In 2006, 5.2 million people, 34% of the Australian population aged 18 years and over, participated in voluntary work. They contributed 713 million hours to the community doing many different activities and in organisations and groups with a diverse range of interests. Overall, 32% of men and 36% of women were volunteers (Table 1).
GEOGRAPHICAL COMPARISONS
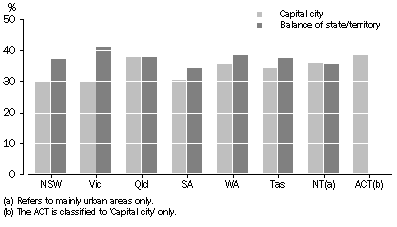
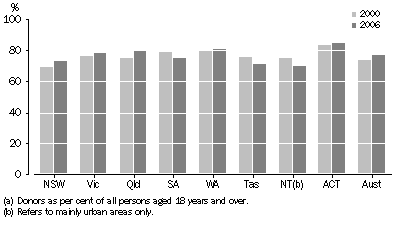
Patterns of volunteering differ by state and territory, and also by part of state. The ACT and Queensland had the highest proportion of volunteers in 2006, with 38% of their population volunteering. Western Australia, Tasmania and the Northern Territory had a 36% volunteer rate.
Volunteering was more common among those living in parts of the state outside the capital city. The volunteer rate was 32% for capital cities overall compared with 38% outside the capital cities. South Australia, Western Australia and Tasmania exhibited this pattern, but the differences were greatest in Victoria and New South Wales. The proportion volunteering in both Sydney and Melbourne was 30%, but in the rest of the two states the proportion was 41% in Victoria and 37% in New South Wales. Queensland (38%) and the Northern Territory (36%) each had volunteer rates that were the same for both types of areas (Table 2).
PARTICIPATION IN VOLUNTARY WORK BY PART OF STATE
WHO VOLUNTEERS?
Volunteer rates varied across different groups in the population. Women volunteered more commonly than men (36% compared to 32%) and, with few exceptions, this was the case regardless of birthplace, family status, labour force status or the areas in which they lived.
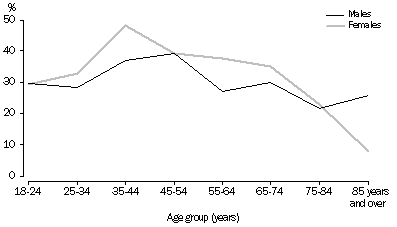
The pattern of volunteering varied with life stage. People aged 35-44 years were in the age group most likely to volunteer (43%) (Table 1). This age group includes a large number of parents with dependent children. Their higher than average volunteer rate reflects their family commitments, most markedly for women. Thus, female partners with dependent children had a volunteer rate of 50% compared with 32% for female partners without dependent children (Table 3).
Table 25 reveals much higher rates of volunteering among parents of school-aged children, (i.e. with children aged 5-14 years) particularly for parents in couple families who are able to provide support to each other with family responsibilities and logistics. Almost two-thirds (64%) of mothers and just over one half (51%) of fathers in this situation had undertaken some voluntary work in the previous 12 months.
VOLUNTEER RATE: AGE
People born in Australia were more likely to undertake voluntary work than those born elsewhere, 36% and 29% respectively. Those born in the main English-speaking countries had a higher rate of volunteering (34%) than those born in other countries (26%)(Table 3).
Other factors associated with above average rates of volunteering were excellent/very good health (38%); current study (43%); level of educational achievement (45% of those with a diploma/advanced diploma and bachelor degree or higher); and high income, 39% for those in the highest quintile of equivalised household income (Table 3).
Relationship with paid employment
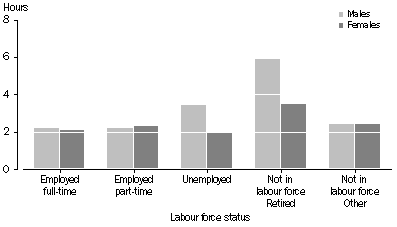
Employed people, either in full-time (34%) or part-time work (44%), had a higher volunteer rate than those who were unemployed (26%) or not in the labour force (30%). Men employed full-time were as likely to volunteer (34%) as women employed on the same basis (33%). However, 55% of employed women worked part-time, and among these women 47% were doing voluntary work, indicating that many may have been choosing part-time participation in the labour force to make other activities possible (Table 3).
While the proportion volunteering was lower for the groups of people not in employment, employed men gave on average 2.2 hours a week to voluntary work, while unemployed men did 3.4 hours of voluntary work a week, and retired men did 5.9 hours. Similarly, retired women did more weekly hours of voluntary work, 3.5 hours, than other women not in the labour force (2.4 hours), and than those who worked part-time (2.3 hours), full-time (2.1 hours) or were unemployed (2.0 hours) (Table 3).
AVERAGE WEEKLY HOURS: LABOUR FORCE STATUS
For employed people, the volunteer rate varied considerably between occupational groupings. Managers/administrators and professionals (both 46%) and advanced clerical and service workers (45%) had the highest participation rates (Table 7). It is not surprising that these largely educated groups have volunteer rates consistent with those of people with higher educational qualifications (Table 3). Intermediate production and transport workers (26%) and labourers and related workers (25%) had lower volunteer rates. Some groups of people have more flexibility in arranging their paid working hours to accommodate voluntary work, and this may have an effect on the participation rates by different occupational groups. The older members (35-64 years) of many occupation groups tended to be more likely to volunteer than their younger colleagues (Table 7).
CHANGES IN VOLUNTEERING OVER TIME
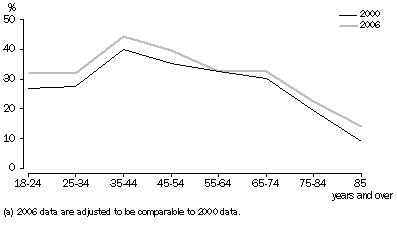
Tables comparing volunteer rates over time are presented in the Appendix. While using the same general definition of volunteering as that used in previous ABS surveys some of the specific criteria used to identify volunteers were refined in the 2006 survey. The Appendix explains these refinements and shows the 2006 data adjusted in a way which is comparable with data from earlier surveys.
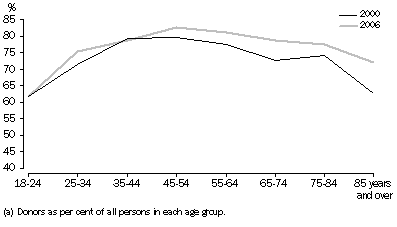
When adjusted to be comparable with the 2000 and 1995 voluntary work surveys, the number of volunteers aged 18 years and over in 2006 was 5.4 million, 35% of the population of the same age. In 2000 there were 4.4 million volunteers, 32% of the population. In 1995, the 3.2 million volunteers represented 24% of the population. Between 2000 and 2006, increases in volunteer rates occurred for both sexes and most age groups.
Volunteer rates by age - 2000 and 2006(a)
In 2006, on a basis comparable with the 2000 survey, volunteers contributed 730 million hours of voluntary work, an increase on the 2000 figure of 704 million and the 512 million hours worked in 1995 (Table A3). However, much of this increase was due to population growth. The annual number of hours contributed on an individual basis was substantially lower, with median hours falling from 74 hours in 1995 to 72 hours in 2000 and to 56 hours in 2006. Lower hours were contributed by both men and women (Table A3).
ORGANISATIONS AND ACTIVITIES
Almost two-thirds of volunteers (62%) worked for one organisation only, 25% for two, 8% for three and 4% for more than three organisations. There was some variation by age, with those aged 18-34 years and those aged 75 years and over less likely to work for more than one organisation (Table 14).
The work a volunteer does for each particular organisation is referred to as a volunteering involvement. During 2006 there were 7.8 million involvements. Most of the organisations for which people had volunteering involvements were in the non-profit sector, 84%, with 14% in the government sector. Government sector organisations were most commonly schools and other educational and training institutions, and emergency services (Table 29).
The organisations through which people volunteered varied in their staffing arrangements, with some fully staffed by volunteers and some having both paid and volunteer staff. On balance, more of people's involvements in volunteering were with organisations which had mixed staff arrangements (i.e. 54% of all involvements had both paid and volunteer staff). The organisation types with the highest proportions of involvements in organisations with mixed staffing were in the areas of education and training (91% of all involvements in this area), international aid and development (67%), health (68%) and law, justice and politics (62%). In contrast the organisation types more likely to be fully staffed by volunteers included sport and physical recreation organisations (72% of all involvements in this area were with groups that were fully staffed by volunteers), parenting, children and youth groups (71% were fully staffed by volunteers) and other recreational and interest groups where 64% of involvements were in interest groups that relied on volunteers alone (Table 29).
The four most common types of organisation for which people volunteered, namely sport and physical recreation, education and training, community/welfare and religious groups, accounted for three-quarters (74%) of volunteering involvements. The remaining quarter includes a very wide range of advocacy, emergency service, environmental, animal welfare, self-development and other recreational and special interest groups.
Volunteers in emergency service type organisations such as those concerned with surf lifesaving and other forms of rescue, fighting bushfires or helping people affected by floods or severe storms provide essential services in times of risk or crisis. In 2006, 175,000 people, one per cent of the population aged 18 years and over, volunteered for emergency service organisations, giving 26 million hours, an average of close to 150 hours per year for each volunteering involvement (Table 18).
Volunteer rate(a): Type of organisation
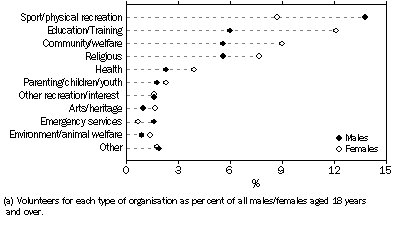
Male volunteers were most likely to be involved in sport/recreation organisations. For females, education/training organisations were most common. Although there were more female than male volunteers overall, there were many more male involvements than female in the fields of sport/recreation and emergency services (Table 18).
Types of voluntary activities
Volunteers perform a range of different tasks when undertaking voluntary work. The activities most frequently reported by volunteers were fundraising, for 48% of their involvements, preparing and serving food (31%), teaching/providing information (28%), administration (26%) and management (23%) (Table 19).
Some of the activities undertaken by volunteers fitted traditional stereotypes. For example, female volunteers were much more likely than male volunteers to be preparing and serving food (for 39% of women's involvements compared with 22% of men's) whereas men were more likely than women to be involved in such activities as repairs, maintenance and gardening (31% compared with 10% of involvements), and coaching and refereeing (28% compared to 12% of male and female involvements respectively).
Generally, though, men and women had fairly similar rates of participation in management, administration, transporting people, performing/media production (which includes newsletters, both paper and internet), lobbying, protecting the environment and other activities.
VOLUNTEER INVOLVEMENTS: ACTIVITY TYPE
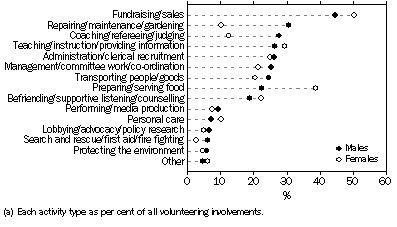
The nature of people's voluntary work was to some extent related to their type of paid employment. Managers and administrators and professionals were more likely than other occupational groups to do management and committee work, professionals to teach or provide information and tradespersons to undertake repairs, maintenance or gardening activities. However, fundraising was the most common activity for almost all occupational groups, and was fairly evenly distributed across all occupations as well as people who were not employed. Administration, food preparation, and transport were also common activities for most occupation groups (Table 30).
Hours volunteered
There was considerable variation in the hours contributed to voluntary work among volunteers. As indicated by the following graph the proportion of volunteers who had undertaken voluntary work for less than 50 hours in the previous 12 months was relatively high and the proportions who had contributed longer hours generally declined as the number of hours increased. Close to one half (46%) of volunteers contributed less than 50 hours in the previous 12 months and 8% of volunteers had contributed at least 400 hours. As a result of this pattern the average hours spent volunteering (136 hours per year or 2.6 hours per week) was greater than the median hours (56 hours per year or 1.1 hours per week).
Proportion of volunteers by total annual hours of voluntary work(a)
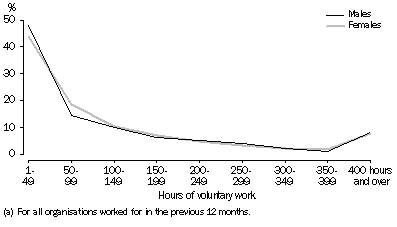
The pattern was much the same for both men and women. However, the median was greater for women than for men (60 hours compared with 52 hours), while men averaged longer annual hours (144 hours compared with 130 hours for women)(Table 1). The differences for averages and medians are consistent with the higher proportion of women clustered in the 50-99 annual hours range in the graph and the much higher average weekly hours for retired men noted earlier. In situations where the distribution of the population is skewed to one side, as is the case here, the median value is commonly taken as the preferred comparative measure because it is less affected by any people who may have worked unusually long hours. However, both medians and averages are useful measures if users remain aware of their properties.
Using median weekly hours as the basis of comparison, seniors spent more time doing voluntary work than younger adults. Among those aged 65-84 years the median was 2.0 hours a week (2.3 hours among men and about 1.6 hours among women) whereas the next highest median hours of 1.5 hours per week (1.3 hours among men and 1.6 hours among women) for any age group was for those aged 55-64 years. The median weekly hours worked by people in younger age ranges were all lower than these. Similar age-related patterns are evident when using the average annual hours measure (Table 1).
Based on data collated for up to three involvements for each volunteer a more detailed view of the time commitments given to volunteering activities is available. These data show that 40% of involvements were undertaken on a weekly basis and 16% of all involvements had been undertaken on a weekly basis and had contributed at least 140 hours in the previous year. Altogether this 16% of involvements, which may be best characterised as being regular high time-commitment involvements, accounted for 62% of the 707 million volunteer hours attributed to identified volunteering involvements. Infrequent low-hour volunteering involvements were also quite common. Some 32% of involvements were undertaken for no more than several times a year, 78% of which were for less than 20 hours in the previous year. Altogether 36% of involvements had been for less than 20 hours in the previous year while 7% had been for 300 hours or more (Table 16).
For the up to three organisations for which volunteers gave details almost half of the volunteering hours (46%) were for two types of organisations: these were sport/physical recreation, with 187 million hours (over 26% of volunteering hours) and community/welfare with 135 million hours (19%). Together with religious (17%) and education/training (10%) organisations they accounted for 73% of the total hours committed to volunteering involvements. These four categories were also the largest in terms of the number of volunteer involvements (Table 18).
Median hours spent working for religious organisations equalled the hours for sport and physical recreation organisations, both 48 hours per year, and these were higher than for all other types of organisations (Table 28). Median hours per year worked by females were considerably greater than those worked by males for education and training (30 hours compared to 12 hours), parenting, children and youth (46 hours compared with 24 hours) and religious organisations (59 hours compared to 36 hours). Sport and physical recreation organisations attracted higher median hours from men (48 hours compared with 40 hours from women) (Table 28).
Costs and reimbursement
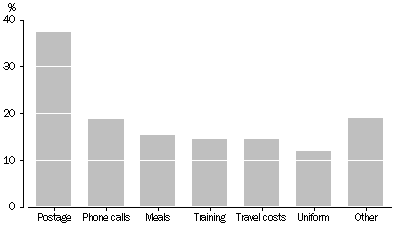
In the course of doing voluntary work, many volunteers incur expenses, such as for telephone calls, travel, and uniforms, or unspecified costs which might include wear and tear on own equipment or income foregone for duration of service. In 2006, 58% of volunteers incurred expenses. Of these 3.0 million volunteers, less than a quarter (23%) advised that reimbursement for specific costs was available from the organisation. The proportion for whom reimbursement was available varied by the type of cost. The most common expense for which reimbursement was available was postage (37%), while the availability of reimbursement was much less likely for uniform (12%), travel (14%) and training costs (15%) and the cost of meals (15%) (Table 17). A further one per cent of volunteers reported receiving an honorarium to cover these costs rather than reimbursement for particular costs.
VOLUNTEERS WHO INCURRED EXPENSES: REIMBURSEMENT AVAILABLE
Ongoing commitment
In 2006, 26% of volunteers had been working for one of their current types of organisations for more than 10 years and 19% had done so for between six to 10 years (Table 27). However, for many volunteers their first experience of volunteering had occurred earlier, with 56% having first volunteered more than 10 years before (Table 9).
One question regular volunteer surveys answer is the extent to which the pool of volunteers is being refreshed by newcomers to voluntary activity. Overall 30% of volunteers in 2006 had been volunteering for five years or less. Naturally, newcomers were more concentrated in younger age groups: 57% of volunteers aged 18-24 years and 44% of those aged 25-34 years had been volunteers for five years or less. The inverse of this is that a high proportion of volunteers in these younger age groups (43% and 56% respectively) had already begun volunteering more than five years before. For every age group above this there was a proportion of relatively new volunteers (i.e. five years or less), but this fell with increasing age from 33% for those in the 35-44 years group to 10% among those aged 75 years or older (Table 9).
Reasons for being a volunteer
Voluntary work provides benefits to the community. Helping others or the community was acknowledged as a current reason for volunteering by 57% of volunteers. More than 50% of both male and female volunteers over all age groups and in all labour force status groups gave ‘helping others or helping the community' as a reason for being a volunteer. However, volunteers also identified benefits to themselves with 44% reporting 'personal satisfaction' and 36% 'to do something worthwhile'. Doing something worthwhile was particularly important for the two oldest age groups. There were 22% of volunteers who gave 'social contact' as their reason for volunteering, and 'to be active' and 'to use skills/experience' each motivated 16% of volunteers. Learning new skills and gaining work experience were given as reasons by 11% of volunteers, ranging from 10% for full-time employed people to 16% for unemployed people (Tables 12 and 13).
VOLUNTEER RECRUITMENT
Almost two-thirds of those who first became involved in voluntary work in the last 10 years were either asked to volunteer by someone (35%) or did so because they knew someone involved (29%). Volunteers were rarely recruited through the media; only 5% became involved in volunteering in response to a media report or an advertisement (Table 10).
There is evidence that family and childhood experiences have some effect on the propensity to volunteer. Over half of the population (52%) reported that at least one of their parents had done voluntary work. The volunteer rate among those whose parents had volunteered was 43% compared with 23% for those whose parents had not volunteered.
Among those people who had been in a religious organisation as a child, 48% said they had done voluntary work in the previous 12 months. The volunteer rate for those who had been in a youth group or had themselves volunteered as a child was also higher than average, 42% in either case (Table 11).
It is also clear that people who recently had some kind of active involvement in community activities were more likely to be doing voluntary work. For example, of those who had been actively involved in a religious organisation in the previous 12 months (which may include their voluntary work activity), 57% were volunteers, compared with 29% of those who did not have such an involvement. Similarly, 44% of those who had attended a community event in the previous six months had volunteered, compared with 16% of those who had not. It is, of course, probable that being a volunteer would lead to a higher level of involvement in community events.
The level of trust in people in general is sometimes put forward as a measure of a strong and cohesive community. Among those who strongly or somewhat agreed that most people could be trusted, 38% were volunteers. The volunteer rate decreased with diminishing levels of trust in others (Table 8).
GIVERS OF MONETARY DONATIONS
Personal donations of money to organisations were made by 11.8 million people, 77% of all people aged 18 years and over, during the 12 months prior to interview. This compares with the 74% of the comparable population in 2000. Giving by age group followed similar patterns in 2000 and 2006, with higher proportions of givers in the age groups most likely to be earning income. A higher proportion of 25-34 year-olds were giving donations in 2006, and this was maintained over the age groups from 45-54 years onwards. As in 2000, women in 2006 were more likely to give donations (81%) than men (73%) (Table 33).
Donor rates(a) - 2000 and 2006
Most state and territory populations increased their donor rate by a small amount between 2000 and 2006. The exceptions were South Australia, Tasmania and the Northern Territory. For Queensland, there was an increase in the proportion of men giving donations from 71% to 77%, and in New South Wales a similar increase in the proportion of women giving, from 72% to 79% (Table 34).
Donor rates(a), by state and territory(b) - 2000 and 2006
People who were volunteers were more likely to have made a donation than those who were not volunteers (85% compared with 72%). There was little difference in the likelihood of giving by other socio-economic status groups. Those with higher levels of educational qualifications had above average rates of giving, 85% of those with diplomas/advanced diplomas and 84% of those with a graduate degree or higher. Part-time employed people (81%), particularly part-time employed women (85%), were more likely to donate, but this may be the effect of this group's strong participation in volunteering. People living in areas in the highest quintile of socio-economic status had an 81% donor rate, compared with 69% for those in the lowest 20% of areas (Table 31).
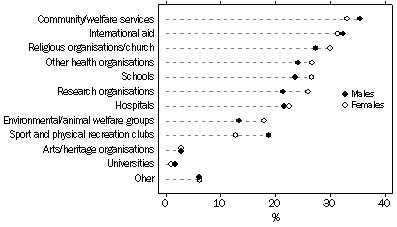
Concern for people's basic welfare needs, be they at home or abroad, appears to be the greatest incentive for people to give money donations. Religious organisations, often having established practices of regular giving by members and adherents, were the next most common recipients.
Donors: Type of recipient organisation
OTHER FORMS OF GIVING TO THE COMMUNITY
As well as volunteering through organisations and giving money to organisations, there are other more direct ways of providing support in the community. Many people are involved in caring for others with special needs, beyond the level of care usually called on in family life. In 2006, 20% of adults had, in the previous four weeks, provided care to someone with a disability, long-term illness or problems associated with old age.
People also provide help to family members in other households, to friends, to neighbours and even to strangers needing assistance, on an informal basis. In the previous four weeks, 49% of people aged 18 years and over had provided assistance to someone outside their own household.
A noteworthy finding about these informal types of assistance is that people who volunteer through organisations are more likely to be also providing informal services to others. In 2006, 27% of volunteers were carers, compared with 17% of those who were not volunteers, and 63% of volunteers were providing informal help to other people in the community compared with 42% of non-volunteers. The level of difference between the response of volunteers and non-volunteers holds across all the age groups. For both volunteers and non-volunteers, women were more likely than men to provide care to someone with a disability or informal help to people with whom they did not live.
Informal help(a)
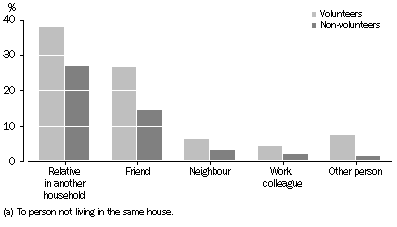
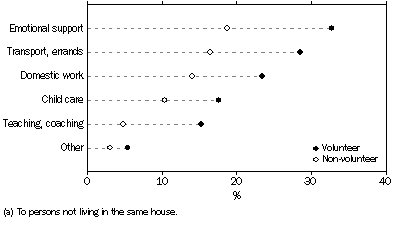
Overwhelmingly, the help Australians provide to others outside their own home is to family and friends although it is likely that many neighbours and colleagues to whom help is given would be regarded as friends. The greatest difference in the type of recipient of help was for 'Other person', where volunteers were many times more likely to help less familiar acquaintances or strangers than non-volunteers would.
Volunteers were also more likely to be providing each of the types of informal help shown. The smallest difference in identified types of help (apart from other unspecified types) was in child care, which was provided by 18% of volunteers and 10% of non-volunteers.
Informal services, Type of help(a)
Overall, people who had volunteered in the previous 12 months in 2006 were also the ones most likely to have been carers, informal helpers to others and donors of money to organisations.
 Print Page
 Print All