4221.0 - Schools, Australia, 2016  Quality Declaration
Quality Declaration ARCHIVED ISSUE Released at 11:30 AM (CANBERRA TIME) 02/02/2017
Page tools:
 Print Page Print Page
 Print All Print All
| ||
|
STUDENT (FTE) TO TEACHING STAFF (FTE) RATIOS 2001-2016 This article looks at changes in student to teaching staff ratios over the last fifteen years from 2001 when the ABS first published these ratios for all school levels. Across all Australian schools, 2016 sees the ratio of teaching staff members to students reach an all time low of 1 teaching staff member to every 13.7 students. In 2001, the ratio was 1 to 14.8. The ratio fell steadily from 2001 to 2008 and then remained largely static until the fall from 13.9 in 2015 to 13.7 in the current year. Since 2001, the ratio has fallen by the greatest amount in the Catholic system, where there were about 1.5 fewer students per teaching staff member in 2016 than there were in 2001 (15.9 down to 14.4). There were falls of around 1 student per teaching staff member over this time in the Government school system (14.8 down to 14.0) and the Independent system (12.8 down to 11.8). The downward shift in the national ratio in 2016 is apparent across schools of all affiliations, but particularly the Catholic sector where the ratio has dropped from 14.7 in 2015 to 14.4 in 2016, driven by growth in the number of teaching staff exceeding the much smaller increase in the number of students in the sector in the last 12 months.  Source(s): Student to Teaching Staff Ratio, by Affiliation and Year-Schools, Australia, 2016 Graph Data group 3 Examining the trend by school level, most of the drop in ratios during the last fifteen years has been at the primary school level. In 2001 there was a ratio of 1 teaching staff member to every 17.0 students in the primary grades. By 2016 this had fallen to 1 to 15.2. The ratio dropped quickly from 17.0 to 16.0 between 2001 and 2006 and then fell more gradually over the next eight years. In the last two years the rate of decline has quickened again (15.6 in 2014 down to 15.2 in 2016). This decline is strongly driven by a shift of year 7 from primary to secondary school in Qld and WA which has resulted in large changes in the number and school level of teaching staff and students in these states in the last two years. Ratios at the secondary level fell gradually from 2001 to 2008 and have remained largely unchanged ever since save a small upwards shift in 2015 which was primarily driven by a significant fall in teaching staff numbers in Tasmania and NT in that year. 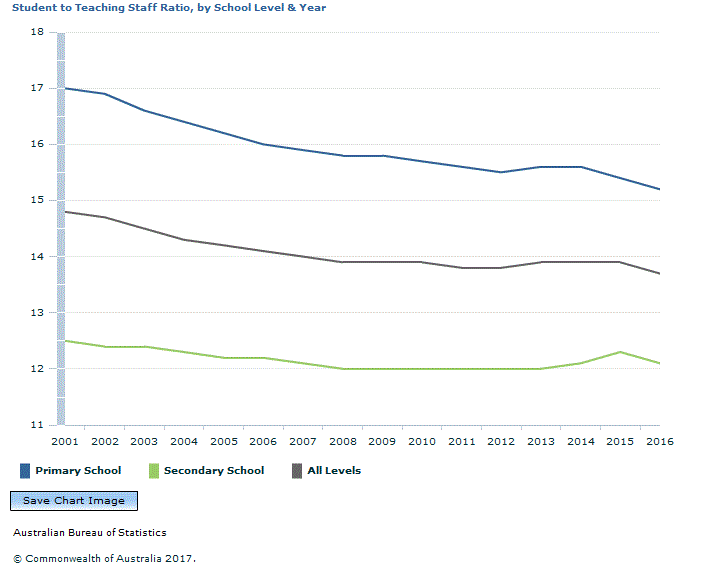 Over the fifteen year period, ratios have fallen consistently across all states and territories, generally mirroring the national trend. The size of these falls are between 0.8 students per teaching staff member (Qld and SA) with a greatest fall of 1.4 (Victoria). Year on year changes in ratios are generally more volatile at the state and territory level than at the national level, particularly when changes occur in the school years taught in primary and secondary settings as mentioned in the previous paragraph. Document Selection These documents will be presented in a new window.
|
|
