4102.0 - Australian Social Trends, Dec 2011
ARCHIVED ISSUE Released at 11:30 AM (CANBERRA TIME) 16/12/2011
Page tools:
 Print Page Print Page
 Print All Print All
| |||||||||||||||||||||||||||||||||||||||||||||||||||||||||||||||||||||||||||||||||||||||||||||||||||||||||||||||||||||||||||||||||||||||||||||||||||||||||||||
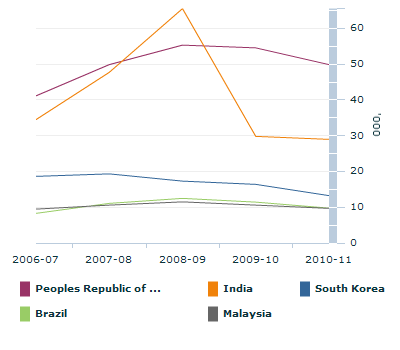
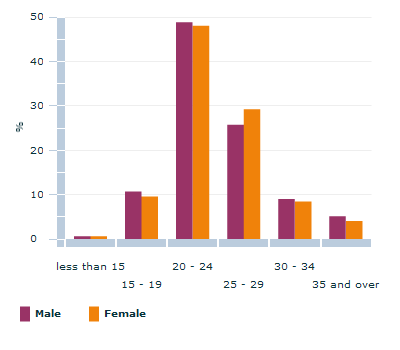
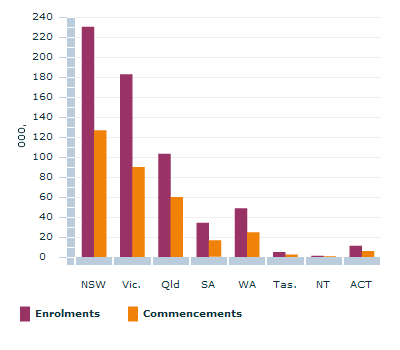
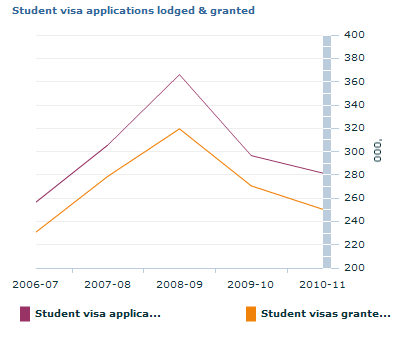
CONTENTS Article - Introduction - Trends in student visa applications - Where are student visa applications coming from? - Enrolments and commencements - Where are enrolments coming from? - Who is studying? - What do international students study? - Where do international students study? - International student experience in Australia - How does Australia compare internationally? - Looking ahead Additional topics - Australia's outbound mobility Explanatory information - Data source and definitions - Endnotes INTRODUCTION International students make a significant contribution to Australian society, diversifying and enriching communities, and strengthening Australia’s global networks. The decision to study in Australia also offers many benefits to international students, allowing them to gain a high quality, internationally recognised education, as well as the opportunity to experience life in Australia. The international education sector is important not only to Australian society, but also the country’s economy. International education activity contributed $16.3 billion in export income to the Australian economy in 2010–11. (Endnote 1) Furthermore, many educational institutions rely on the income from full-fee paying international students to assist in the provision of quality education to all students, both international and domestic. In 2009, over one in five (22%) tertiary students studying in Australia were international students. (Endnote 2) While the size of the international student population is considerable both in tertiary and other sectors, Australia’s international education sector is undergoing a period of change. This change is driven by adjustments to Australia’s migration policy, as well as changing perceptions of the Australian education market, the increased value of the Australian dollar, and the growth of Australia’s overseas competitors. The process of becoming an international student in Australia involves a number of steps, the most significant of which are enrolling in the student’s course of interest, and applying for a student visa through the Department of Immigration and Citizenship (DIAC). Student visa data obtained from DIAC can be examined to gain an understanding of trends in the international student sector. There are numerous ways to measure the size of the international student sector (Endnote 3), with different data sources offering alternative perspectives. To examine recent changes in the sector, this article will investigate both student visa and student enrolments data in Australia. TRENDS IN STUDENT VISA APPLICATIONS To be eligible for an Australian student visa, applicants must be accepted for full-time study with a registered institution, as well as meet various financial, health and character conditions. (Endnote 4)The visa covers the duration of the course applied for. Over the four years to 2010–11, applications for Australian student visas increased sharply to 2008–09, followed in turn by an almost equally sharp decline in the subsequent two years. In 2010–11, there were 282,000 student visa applications lodged in Australia, including both onshore and offshore applications. This is a decline of 5.1% from 2009–10 and 23% less than the peak of 2008–09. Despite this decline, the number of student visa applications in 2010–11 is still higher than the number recorded in 2006–07. Almost half (43%) of international student visa applications in 2010–11 were within the higher education sector, and more than a quarter (30%) were for the Vocational Education and Training (VET) sector. Declines in student visa applications were most prominent in the VET sector, which after considerable growth between 2006–07 and 2008–09 (up 150%), declined by more than a third (37%) between 2008–09 and 2010–11. These recent declines in student visa applications can be attributed to a number of factors, including changes to student visa regulations (for example, requiring international students to demonstrate their financial resources), and changes to the General Skilled Migration program, which have made the transition from international student to permanent residency more difficult. (Endnote 5) International media attention regarding incidents of violence against international students has had damaging effects on Australia’s reputation as a safe destination for study, particularly among Indian nationals. Furthermore, the rise of the Australian dollar, which has a direct effect on the cost of living in Australia compared with alternative destinations, and increased competition from other countries in the international education market, may have had some effect on decreasing levels of visa applications. (Endnote 5) Applications granted Not all student visa applications made were granted. While there is no limit on the number of student visas issued each year, applicants must meet all necessary requirements to be granted a student visa. STUDENT VISA APPLICATIONS GRANTED BY TOP FIVE COUNTRIES OF ORIGIN  In 2010–11, there were 250,000 student visa applications granted. This is a decline of 22% from a peak in 2008–09, but still higher than the 231,000 applications granted in 2006–07. This decline follows a similar pattern to applications lodged. The proportion of applications granted to each sector mirrors applications lodged, with almost half (45%) granted to Higher Education applicants, and over a quarter (27%) to VET applicants in 2010–11. Similarly, declines in applications granted were largest in the VET sector, down 35% from the 2008–09 peak of 104,000 student visa applications granted. WHERE ARE STUDENT VISA APPLICATIONS COMING FROM Recent years have seen China continue as the largest single nation contributor to the international student population in Australia. In 2010–11, one fifth of all student visa applications lodged and granted were from China (18% and 20% respectively), followed by India (14% and 12% respectively) and South Korea (both 5%). Between 2008–09 and 2010–11, declines in student visa applications lodged and granted have been seen amongst all of the top five contributor nations. The most prominent declines were from Indian nationals, where the number of applications lodged and granted halved (51% and 56% respectively). In 2008–09, India had accounted for one in five of all student visa applications lodged (22%) and granted (20%), but in 2010–11 this had reduced to 14% and 12% respectively. ENROLMENTS AND COMMENCEMENTS Prior to gaining a student visa, international students must have a confirmation of enrolment from their selected education institution. Recent trends in student visa data were mirrored in student enrolment and commencement data, compiled by Australian Education International (AEI). Many international students enrol in and commence more than one course of study in one year, and this creates a discrepancy between the number of enrolments and the number of student visas granted. In 2010, there were 617,000 overseas student enrolments in various courses across all international education sectors. This was down from the 631,000 student enrolments in 2009, representing a decline of 2.2%, according to AEI student enrolment data. This was still 14% higher than the 542,000 enrolments in 2008. The number of international student commencements also declined between 2009 and 2010. In 2010, there were 327,000 commencements, down 37,000 on 2009 figures and representing a decline of 10%. Between 2009 and 2010, enrolments declined in all sectors except Higher Education, which increased to 242,000, a growth of 7.3%. In 2010, two in every five (39%) overseas student enrolments were for an undergraduate or postgraduate qualification. Commencements declined in all sectors including Higher Education, with the largest fall in the ELICOS sector, down 21%. WHERE ARE ENROLMENTS COMING FROM The decline in enrolments varied according to which country students were from, and this decline was not consistent across all sectors. Student enrolments from China, the largest contributor country of international students, increased by 6.0% between 2009 and 2010, due to increases in the Higher Education sector (up 18%) and the ‘Other’ sector (up 17%). In total over one quarter (27%) of all international student enrolments came from China. AGE DISTRIBUTION OF INTERNATIONAL STUDENTS STUDYING IN AUSTRALIA - 2010  Source(s): Australian Education International data, 2010 And commencements? Commencements from China were similar between 2009 and 2010, though in the Higher Education sector commencements rose 14%, suggesting that unlike other countries, the international student market from China, particularly for higher education, has remained strong, though perhaps not completely untouched by recent movements in the Australian international student sector. International student enrolments and commencements from India decreased between 2009 and 2010, down 17% and 38% respectively. These declines were apparent across all sectors, though Indian nationals were still the second highest contributor to international student enrolments (16%) and commencements (13%) in 2010. WHO IS STUDYING In 2010, there were 470,000 international students studying in Australia. (Endnote 6) Over three quarters (76%) of these students were aged 20 - 29 years, reflecting the fact that most international students were studying in the Higher Education and VET sectors. International students studying in Australia in 2010 were more likely to be men (54%) than women (46%), though the gender distribution of international students varies according to nationality. For example, according to Australian Education International (Endnote 7), almost two-thirds (63%) of international students who commenced study in the first half of 2011 from India and Nepal were men. In contrast, almost two thirds of those from Thailand (63%) and the United States of America (62%) were women. China, Korea, Vietnam and Malaysia also had more female than male students commencing study in the first half of 2011. In 2010, there were more male than female international students in all education sectors with the exception of the ‘Other’ sector (52% female), which includes Study Abroad commencements from the US (short term study programs) and enabling courses (designed to prepare students for further study). Men were particularly more likely to be studying in the VET sector (59%) than women (41%). INTERNATIONAL STUDENT ENROLMENTS AND COMMENCEMENTS BY STATE AND TERRITORY - 2010  WHAT DO INTERNATIONAL STUDENTS STUDY? International students study a range of different courses in Australia. While a small proportion study in schools and other post-secondary courses, most international students (80%) were engaged in Higher Education and VET courses in 2010, with some of these students having also studied English through an ELICOS provider. Of international enrolments and commencements in Higher Education in 2010, ‘Management and Commerce’, which includes study fields such as accounting, business and management, and sales and marketing, was the largest broad field of education, with about half of enrolments (52%) and commencements (54%) in this field. No other individual broad field of education contributed more than 10% of enrolments or commencements in the higher education sector. (Endnote 8) In 2010, ‘Management and Commerce’ was also the largest broad field of education for the VET sector, with over two fifths (43%) of enrolments and almost half (48%) of commencements in this field. (Endnote 8)
Source: Australian Education International, October 2011 Research Snapshot: Onshore international students as a proportion of all onshore students by university, 2010 WHERE DO INTERNATIONAL STUDENTS STUDY More international students studied in New South Wales than any other state or territory in 2010, with over one-third of all international student enrolments (37%) and commencements (39%) taking place in NSW, followed by Victoria (30% and 28% respectively). A recent report by Australian Education International reveals that the distribution of international students is not equal among universities (Endnote 9), with certain institutions having higher proportions of onshore international students than others. For example, in 2010 almost half (48%) of students at the University of Ballarat in Victoria were international students. In comparison, 6.7% of students studying at The University of New England in NSW were international students. (Endnote 9)The high proportion of international students in some universities may make these institutions more sensitive to fluctuations in the industry as a whole. A similar report into public VET institutions (Endnote 10) shows that the dispersal of international students studying in these institutions in 2010 was considerably more even than at universities, with no single public VET institution having an international student population greater than 16% (Holmesglen Institute of TAFE in Victoria). These differences are most likely due to the types of courses offered at different universities and VET institutions, with some catering for the needs of international students with specific international student programs. While some universities have larger proportions of international tertiary students, the actual number of international students is more evenly dispersed. Larger numbers of international students can be found in Australia’s largest universities, with Monash University having both the highest number of domestic (40,300) and onshore international students in Australia (13,400), followed by the University of New South Wales (36,300 and 13,200 respectively). Along with quality education and course options, it is likely that international students consider other factors such as proximity to major cities and infrastructure when deciding where to study.
(b) 2010 data has not been published for this institution, 2009 data has been shown. Source: Australian Education International, October 2011 Research Snapshot: Onshore international students as a proportion of all onshore students by university, 2010 INTERNATIONAL STUDENT EXPERIENCE IN AUSTRALIA The experience of studying abroad can vary from student to student, dependent on factors such as the quality of the chosen course and institution, support, and friendships they develop in their chosen country. MARKET SHARE OF INTERNATIONAL TERTIARY STUDENTS - 2000, 2009(a) .gif) Footnote(s): (a) The proportion of students abroad is based only on the total of students enrolled in countries reporting data to the OECD and UNESCO Institute for Statistics. (b) Excludes advanced research programmes. Source(s): Organisation for Economic Co-operation and Development, Education at a Glance, 2011 The International Student Survey (2010) (Endnote 11) indicates how satisfied international students were with their Australian education experience. Overall, most international students studying in Australia were satisfied with their study and living experience in 2009–10. Nearly nine in ten of those studying in the VET sector (88%) and the Higher Education and ELICOS sectors (both 86%) were satisfied with their living experience in Australia. Overall satisfaction with study experience was equally high, with almost nine in ten students in the ELICOS (86%), VET (85%) and Higher Education (84%) sectors reporting that they were satisfied with their studies. Safety The International Student Survey (2010) (Endnote 11) also found that in 2009–10 almost nine in ten international students in the VET (88%) and Higher Education (86%) sectors and eight in ten (80%) ELICOS students were satisfied with their safety while studying in Australia. In comparison, 94% of domestic Higher Education students recorded high satisfaction levels for safety. Familiarity with language, culture and geography may explain some of the difference between domestic and international students in this respect. HOW DOES AUSTRALIA COMPARE INTERNATIONALLY Despite recent declines in the Australian international education sector, it continues to be an important sector, both in Australia and internationally. The growth of transnational education in recent decades has not been limited to Australia. In 2009, almost 3.7 million tertiary students were enrolled to study outside their country of citizenship, increasing four fold from 0.8 million in 1975. (Endnote 2) In 2009, over one in five (22%) tertiary education students in Australia were international students. (Endnote 2) This is the highest proportion of international students in all OECD countries followed by the United Kingdom (15%) and Austria (15%). Australia’s share of the international student market increased from 5.1% in 2000 to 7.0% in 2009, (Endnote 2) making Australia the third largest provider of international education services in 2009, behind the United States (18%), and the United Kingdom (10%). Considering the relative size of Australia’s population, such high representation amongst the international student market is indicative of the ongoing importance of this sector to Australia, both economically and for communities. LOOKING AHEAD Given the important contribution the international student sector makes to Australia’s economy and society, ensuring the future strength of the industry is an ongoing priority for government. Initiatives intended to further improve the experience of international students and the quality and integrity of the international student education sector in Australia are underway. These include the Council of Australian Government’s (COAG) International Students Strategy for Australia (2010–2014), (Endnote 12) and changes to the Education Services for Overseas Students (ESOS) Act 2000. (Endnote 13) Furthermore, following the Knight Review of the student visa program, numerous reforms have recently been announced, including the streamlining of visa processing for some international students, and reducing the financial requirements for some student visa applicants. (Endnote 15) ADDITIONAL TOPICS
EXPLANATORY INFORMATION
ENDNOTES 1 Australian Education International, 2011, Research Snapshot : Export Income to Australia from Education Services in 201-110, AEI, accessed 16 November 2011, <www.aei.gov.au>.2 Organisation for Economic Co-operation and Development, Education at a Glance 2011: OECD Indicators, 2011, Paris, accessed 24 October 2011, <www.oecd.org>.3 Australian Bureau of Statistics, 2007, Perspectives on Migrants, cat. no. 3416.0, Australia.4 Department of Immigration and Citizenship, Student visa program trends, 2004-05 to 2010-11, accessed 11 October 2011, <www.immi.gov.au>.5 Deloitte Access Economics (commissioned by Universities Australia), Broader implications from a downturn in international students, 30 June 2011, accessed 24 October 2011. 6 Australian Education International, 2011, Research Snapshot: International student numbers 2010, AEI, viewed 18 October 2011, <www.aei.gov.au>.7 Australian Education International, August 2011, Research Snapshot: Gender distribution of international students commencing in 2011, AEI, accessed 18 October 2011, <www.aei.gov.au>.8 Austrade, Australian Education International, International Student Enrolments for 2010, accessed 18 October 2011, <www.austrade.gov.au>.9 Australian Education International, October 2011, Research Snapshot: Onshore international students as a proportion of all onshore students by university, 2010, AEI, accessed 18 October 2011, <www.aei.gov.au>.10 Australian Education International, October 2011, Research Snapshot: Onshore international students at public VET Institutions, 2010, AEI, accessed 18 October 2011, <www.aei.gov.au>.11 Australian Government, Australian Education International, International Student Survey 2010 Overview Report ,December 2010, accessed 18 October 2011, <www.aei.gov.au>.12 Council of Australian Governments, 2010-2014, International Students Strategy for Australia, COAG, accessed 19 July 2011, <www.coag.gov.au>.13 Australian Government, Education Services for Overseas Students (ESOS) Act 2000 Amendments, accessed 18 October 2011, <www.comlaw.gov.au>.14 Australian Education International, 2006, Research Snapshot : Enrolments, commencements and student numbers – explanatory note, AEI, accessed 1 November 2011, <www.aei.gov.au>.15 Department of Immigration and Citizenship, 2011, Fact sheet – Government Response to the Knight Review of the Student Visa Program, accessed 7 November 2011, <www.immi.gov.au>. Document Selection These documents will be presented in a new window.
|
|||||||||||||||||||||||||||||||||||||||||||||||||||||||||||||||||||||||||||||||||||||||||||||||||||||||||||||||||||||||||||||||||||||||||||||||||||||||||||||

