CENSUS OF POPULATION AND HOUSING
The Census collects detailed information about people employed in sport and physical recreation occupations and industries. However, the employment information relates to the main job in the week before Census and does not include second jobs, unpaid work, or people usually working in a sports and physical recreation occupation but 'between jobs' during the week before Census night. Some people employed in sport and physical recreation occupations will not have been recorded as such during the Census period because some types of sport and physical recreation work are seasonal in nature (e.g. cricket umpiring).
Employment in sport and physical recreation occupations
Of all people employed in the week prior to the 2006 Census, 75,155 people (0.8%) had their main job in a sport and physical recreation occupation. For the 2001 Census the corresponding figure was 61,272 people which was 0.7% of total employment. The increase in employment for sport and physical recreation occupations between 2001 and 2006 was 23%. In comparison, the increase for all occupations over the same period was 9.7%.
The sport and physical recreation occupations recording the largest numbers of people employed in 2006 were fitness instructors (13,799), greenkeepers (12,137), swimming coach or instructors (7,585), stablehands (3,880) and other sports coach or instructors (3,461).
The majority of sport and physical recreation occupation groups showed some increase in employment between the 2001 and 2006 Censuses.
In comparison, there were only a few sport and physical recreation occupation groups that experienced a decline in numbers between 2001 and 2006. In percentage terms, the number of recreation officers fell 46% (from 3,842 to 2,061) and the number of jockeys fell 42% from 1,124 in 2001 to 649 in 2006.
Of the 75,155 people employed in sport and physical recreation occupations, there were more men (44,443 or 59%) than women (30,712 or 41%). In comparison, of all employed people, 54% were male and 46% were female.
People employed in sport and physical recreation occupations had a younger age profile relative to all employed people. The 20 to 24 year age group had the largest number of people employed in sport and physical recreation occupations (13,403 or 17%). There were also considerably more younger workers employed in occupations such as sports umpires, lifeguards and footballers. By contrast, over 40% of those employed as horse breeders or dog or horse racing officials were aged 50 years or over.
8.1 Employment in sport and physical recreation occupations, By sex - 2001 and 2006 |
|
 |  | 2001 Census(a) | 2006 Census(b) |
 |  | Males | Females | Persons | Males | Females | Persons |
|
| Occupations |  |  |  |  |  |  |
 | Animal trainer(c) | 2 251 | 875 | 3 126 | na | na | na |
 | Bungy jump master | na | na | na | 10 | - | 10 |
 | Canvas goods maker | 354 | 257 | 611 | 419 | 316 | 735 |
 | Diving instructor (open water) | na | na | na | 394 | 147 | 541 |
 | Dog handler or trainer | na | na | na | 326 | 249 | 575 |
 | Dog or horse racing official | 365 | 45 | 410 | 459 | 81 | 540 |
 | Fishing guide | na | na | na | 93 | 3 | 96 |
 | Fitness centre manager | 626 | 537 | 1 163 | 750 | 914 | 1 664 |
 | Fitness instructor | 3 685 | 8 679 | 12 364 | 5 075 | 8 724 | 13 799 |
 | Footballer | 1 377 | 8 | 1 385 | 1 440 | 13 | 1 453 |
 | Golfer | 1 084 | 38 | 1 122 | 1 162 | 55 | 1 217 |
 | Greenkeeper | 11 637 | 291 | 11 928 | 11 816 | 321 | 12 137 |
 | Gunsmith | 146 | 3 | 149 | 171 | 6 | 177 |
 | Gymnastics coach or instructor | 281 | 1 151 | 1 432 | 411 | 1 633 | 2 044 |
 | Horse breeder | 688 | 541 | 1 229 | 766 | 651 | 1 417 |
 | Horse riding coach or instructor | 107 | 458 | 565 | 78 | 527 | 605 |
 | Horse trainer | na | na | na | 1 967 | 797 | 2 764 |
 | Hunting guide |  |  |  |  |  |  |
 | Jockey | 813 | 311 | 1 124 | 501 | 148 | 649 |
 | Lifeguard(d) | na | na | na | 1 687 | 907 | 2 594 |
 | Mountain or glacier guide | na | na | na | 13 | 6 | 19 |
 | Other sports and fitness workers nfd(e) | 519 | 278 | 797 | 761 | 543 | 1 304 |
 | Other sports coach or instructor | 1 991 | 887 | 2 878 | 2 529 | 932 | 3 461 |
 | Other sports official | 89 | 35 | 124 | 95 | 23 | 118 |
 | Outdoor adventure instructor or leader | 350 | 198 | 548 | 519 | 313 | 832 |
 | Outdoor adventure guides nec | na | na | na | 149 | 61 | 210 |
 | Recreation officer | 1 035 | 2 807 | 3 842 | 773 | 1 288 | 2 061 |
 | Sail maker | 398 | 35 | 433 | 428 | 43 | 471 |
 | Snowsport instructor | na | na | na | 391 | 186 | 577 |
 | Sports administrator | 652 | 431 | 1 083 | 1 185 | 721 | 1 906 |
 | Sports centre manager | 1 741 | 1 059 | 2 800 | 2 071 | 1 336 | 3 407 |
 | Sports development officer | 432 | 241 | 673 | 559 | 339 | 898 |
 | Sports umpire | 1 840 | 698 | 2 538 | 1 804 | 579 | 2 383 |
 | Sportspersons nec(f) | 1 965 | 826 | 2 791 | 710 | 133 | 843 |
 | Stablehand | 1 626 | 1 867 | 3 493 | 1 613 | 2 267 | 3 880 |
 | Swimming coach or instructor(g) | 506 | 381 | 887 | 1 607 | 5 978 | 7 585 |
 | Tennis coach | 1 419 | 358 | 1 777 | 1 677 | 468 | 2 145 |
 | Trekking guide | na | na | na | 6 | 4 | 10 |
 | Whitewater rafting guide | na | na | na | 28 | - | 28 |
| Total sport and physical recreation occupations(h) | 37 977 | 23 295 | 61 272 | 44 443 | 30 712 | 75 155 |
| Total employment | 4 546 783 | 3 751 823 | 8 298 606 | 4 911 129 | 4 193 055 | 9 104 184 |
|
| - nil or rounded to zero (including null cells) |
| na not available |
| (a) ASCO was used for the collection of ABS occupation data. |
| (b) ANZSCO was used for the collection of ABS occupation data. |
| (c) Includes Dog handler or trainer, Horse trainer, Animal trainers nfd and Animal trainers nec. |
| (d) Lifeguards were included with Sportspersons nec in 2001. |
| (e) Includes Sports and personal services workers nfd, sports and fitness workers nfd and Sports, Coaches, Instructors and Officials nfd. |
| (f) Includes Sportspersons nec and Sportspersons nfd. |
| (g) Swimming instructors and teachers were included with Fitness instructors in 2001. This category only included Swimming coaches in 2001. |
| (h) Small cells or census data are randomly adjusted to protect confidentiality. There may be minor discrepancies between column and row total in tables containing similar data. |
| Source: Employment in Sport and Recreation, Australia, August 2006 (cat. no. 4148.0). |
Earnings and hours worked
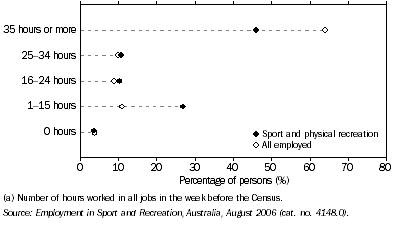
The 2006 Census found that, compared to people employed in all occupations, people employed in sport and physical recreation occupations (as their main job) were more likely to be working part-time (i.e. less than 35 hours per week). Nearly two thirds (64%) of people employed in all occupations worked full-time (i.e. 35 hours and over). By comparison, only 46% of people employed in sport and physical recreation occupations worked full-time. Relatively large percentages of people employed as sports umpires (94%), gymnastics coaches (85%) and fitness instructors (69%) worked part-time.
8.2 Weekly hours worked profile of occupations(a) - August 2006

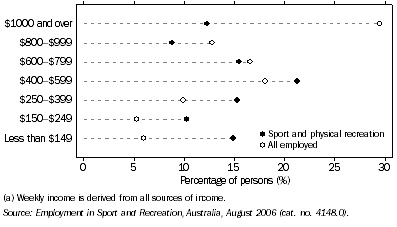
There was a higher percentage of people employed in all occupations (30%) with a weekly income of $1,000 or more compared with people employed in sport and physical recreation occupations as their main job (12%). This lower income may be related to the higher incidence of part-time employment in sport and physical recreation occupations.
Over half (52%) of all people employed in sport and physical recreation occupations received a gross weekly income between $250 and $799.
8.3 Weekly income profile of occupations(a) - August 2006

 Print Page
 Print All