1301.0 - Year Book Australia, 2001  
ARCHIVED ISSUE Released at 11:30 AM (CANBERRA TIME) 25/01/2001   
   Page tools: Print Print Page

CHANGING DWELLING AND HOUSEHOLD SIZE

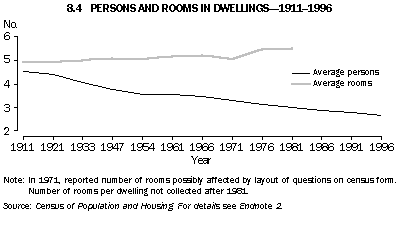
Since data were collected in the first Australian Census in 1911, there has been a slow but steady increase in the size of Australian dwellings, as demonstrated by the rise in the average number of rooms over the period to 1981. This increase occurred despite a steady decline in the average number of persons per dwelling (from 4.5 to 3.0 persons) over the same period (graph 8.4). These changes have meant that, between 1911 and 1981, the average number of persons per room declined from 0.9 to 0.5 persons. The average size of new homes has continued to increase over the last two decades. Between 1986 and 1999, the average size of new dwellings increased almost 30% (to 185.5 square metres).1


The trend toward smaller households can be attributed to factors such as changing patterns of household formation. For example, rising divorce and separation rates often lead to the formation of smaller households. Another example is the trend for couples first to delay starting a family, then to have fewer children.

Between 1921 and 1996 the proportion of two person households increased from 13.9% to 32.4%. There has also been a marked increase in the proportion of one person households, particularly over the latter half of the 20th century.

This can, in part, be attributed to the ageing of the Australian population. Older persons, left alone after the death of their partner, contribute significantly to the numbers of single person households. Between 1911 and 1961 the proportion of single person households fluctuated only slightly (between 8% and 11%). By 1996, a total of 1.4 million persons, nearly a quarter (23%) of all households, lived alone (graph 8.5). Some 38.5% of these households comprised persons aged 65 and over.


Endnotes

1 Australian Social Trends 2000 (4102.0).

2 In addition to unpublished data from the Census of Population and Housing for 1971, 1976, 1981, 1986, 1991 and 1996, data for the graphs and text in this article were drawn from a range of publications relating to Censuses between 1911 and 1996.