GRAIN (CEREALS)
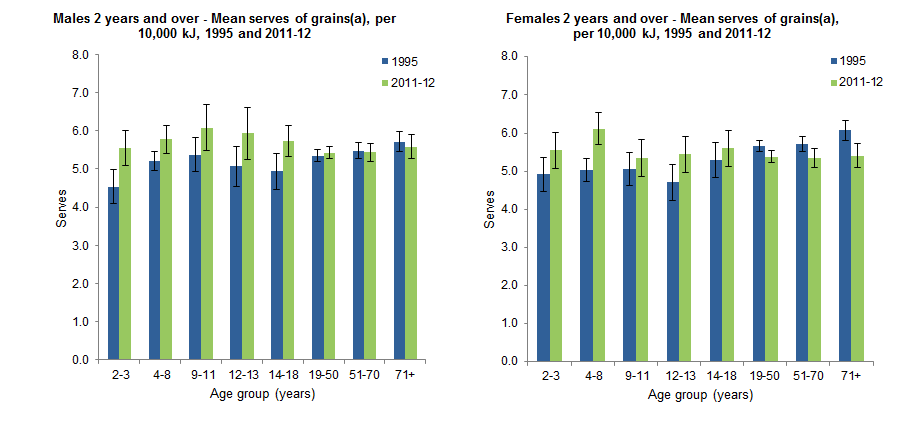
The average consumption of the grain (cereal) food group was similar in each period, at just under 5.5 serves per 10k kJ in both 1995 and 2011-12. However, there was a relative increase in the consumption by children aged 2-18 years (from 5.1 to 5.5 serves per 10,000 kJ), and a small decrease among those aged 19 years and over (5.6 to 5.4 serves per 10,000 kJ). The decline in the adult grain consumption was primarily driven by a 12% decrease in bread consumption, although that was partially offset from by a 14% increase in consumption of other grains (excluding oats) (mostly rice, pasta and noodles).1 Greater consumption of other grains (excluding oats) was also responsible for half of the children’s overall increase in grains consumption, with much of the remaining increase coming from bread, oats and savoury crackers.

(a) From non-discretionary sources, Based on Day 1. See Glossary for definition.
Sources: National Nutrition and Physical Activity Survey, 2011-12 and National Nutrition Survey, 1995
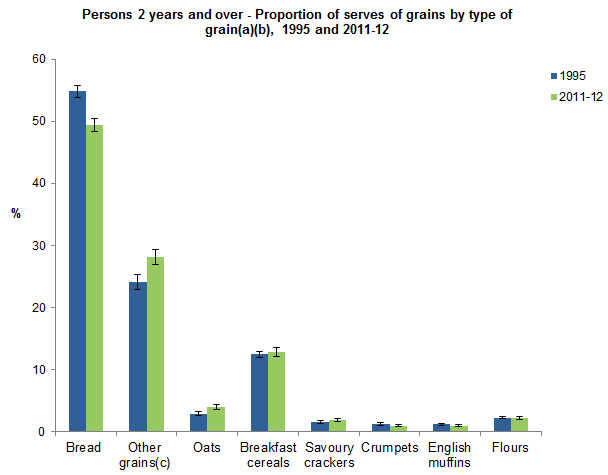
Overall, the proportion of grains serves coming from bread decreased from 55% to 49% between 1995 and 2011-12, while the proportion coming from other grains (excluding oats) increased from 24% to 28%. Breakfast cereals were the third largest source of grains with around 12% in 1995 and 13% in 2011-12.

(a) From non-discretionary sources, Based on Day 1. See Glossary for definition.
(b) Based on grain (cereal) subgroups within the underlying ADG database (combining wholegrain/high fibre varieties with refined varieties). See Explanatory Notes for more information.
(c) Other grains comprises mostly rice, pasta and noodles.
Sources: National Nutrition and Physical Activity Survey, 2011-12 and National Nutrition Survey, 1995
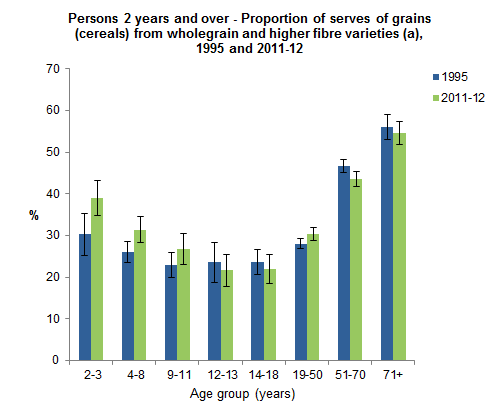
Around one-third (34%) of all grains consumed in 2011-12 were the wholegrain or higher fibre variety, a slight increase on the proportion in 1995 (32%). Most of this improvement was from children aged 2-11 years, where the proportion increased from 26% to 31%. In both periods, the older age groups consumed the highest proportions of grains and wholegrain/ higher fibre, but in 2011-12 level (47%) was slightly lower than the 1995 level (49%) for the combined 51 years and over population.

(a) From non-discretionary sources, Based on Day 1. See Glossary for definition.
Sources: National Nutrition and Physical Activity Survey, 2011-12 and National Nutrition Survey, 1995
Discretionary sources of grains
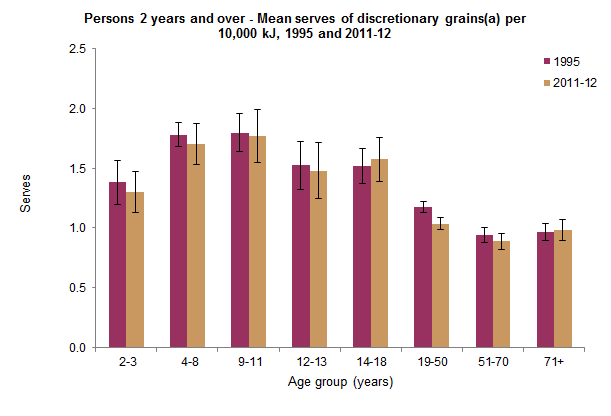
If the serves of grain (cereals) from discretionary foods were counted, they would add an extra 1.2 and 1.1 serves per 10,000 kJ in 1995 and 2011-12 respectively. Leading the food groups contributing the discretionary grain (cereal) serves were pastries which made up 27% of discretionary serves in 1995, and 21% in 2011-12. Cakes and muffins contributed 15% in 1995, similar to the level in 2011-12 (16%), while sweet biscuits contributed 12% and 13% of the discretionary grains respectively in 1995 and 2011-12.

(a) From discretionary sources. Based on Day 1. See Glossary for definition.
Sources: National Nutrition and Physical Activity Survey, 2011-12 and National Nutrition Survey, 1995
ENDNOTES
- The breakdown of grains (cereals) is based on the subgroups within the underlying ADG database (combining wholegrain/high fibre varieties with refined varieties). See Assessing the 2011-13 AHS against the Australian Dietary Guidelines - Classification System and Database Development Explanatory notes, available from: http://www.foodstandards.gov.au/science/monitoringnutrients/Pages/default.aspx
 Print Page
 Print All