Page tools:
 Print Page Print Page
 Print All Print All
| ||
|
CORE ACTIVITY NEED FOR ASSISTANCE, 2016 INTRODUCTION Disability affects about one in five Australians to varying degrees and in different ways (Disability, Ageing and Carers, Australia: Summary of Findings, 2015 cat. no. 4430.0). This can range from someone who has a mild hearing impairment that is overcome with the use of hearing aids, to a person who cannot wash or dress themselves due to a mobility restriction. This article presents information about Australians with a need for assistance and is based on data collected in the 2016 Census of Population and Housing (the ‘Census’). The article presents information about the living arrangements, population characteristics, and education and labour force participation of this population. This information is important in the planning and management of disability services and targeted support for those living with disability. The Census and Survey of Disability, Ageing and Carers There are four questions in the 2016 Census that collect information about a person’s need for assistance. These questions are based on the Survey of Disability, Ageing and Carers (SDAC) concept of 'Profound or severe core activity limitation’; the population for whom service delivery has the most consequence. The Census questions collect information from people about their need for assistance with one of the core activity areas of self-care, communication or mobility because of a disability, long-term health condition or the effects of old age. Three of the questions establish a need for assistance in one of the core activities, and the fourth question identifies the reasons this assistance was necessary. The Census allows us to examine a range of detailed demographic and socio-economic characteristics of those needing assistance, their geographic distribution, and the identification of small sub-populations that may be at higher risk of needing assistance. In comparison, SDAC provides in-depth information about the details of a person’s disability, the activities they need support with, and who supports the person. SDAC uses detailed interview administered questions which are not feasible for inclusion in the Census. The survey was last conducted in 2015 and is due to run again in 2018. Together, the SDAC and the Census help build the picture of disability in Australia. THE DEMOGRAPHIC CHARACTERISTICS OF PEOPLE WITH A NEED FOR ASSISTANCE The 2016 Census of Population and Housing showed that the number of people with a need for assistance with core activities increased to 1,202,900 people or 5.1% of the population in 2016, up from 998,600 people, or 4.6% of the population in 2011. As was the case in 2011, females were more likely to have need for assistance than males in 2016 (5.4% compared with 4.8%).  Source(s): ABS Census of Population and Housing, 2011 and 2016 Reflecting the strong relationship between age and disability, the proportion of people in need of assistance increased with age. Some 1.1% of people aged 0-4 years needed assistance in 2016, increasing to 47% of people aged 85 years and over. Consistent with this, people with a need for assistance had a much older age structure than people who did not have a need for assistance. Some 53% of people who had a need for assistance were aged 65 years and older, compared with 13% of those who did not have a need for assistance. For people aged 75 and over, there were proportionally more women than men with a need for assistance (32% of women compared with 24% of men in 2016). This is the result of the different disease profiles seen in males compared with females, with females experiencing higher rates of disease commonly associated with disability. For example, the 2014 National Health Survey shows Australian women aged 75 years or older were almost 50% more likely to report having arthritis than men of the same age. However, around the ages of 5 to 19, males were almost twice as likely as females to report a need for assistance (4% or 88,600 males compared with 2.1% or 43,700 females). Analysis of the 2015 SDAC results show this may be partly due to autism spectrum disorders which are more commonly found in males of this age group (for further information, please see Autism in Australia, in cat. no. 4430.0). , 2016.GIF) Source(s): ABS Census of Population and Housing, 2016 WHERE THOSE WITH A NEED FOR ASSISTANCE LIVE State and territories The proportion of people with a need for assistance varies across Australia’s states and territories. Tasmania had the highest proportion of people who needed assistance in 2016 (6.4% or 32,600 people) while the Northern Territory and Western Australia had the lowest (3.0% or 6,900 people and 3.9% or 95,700 people, respectively). 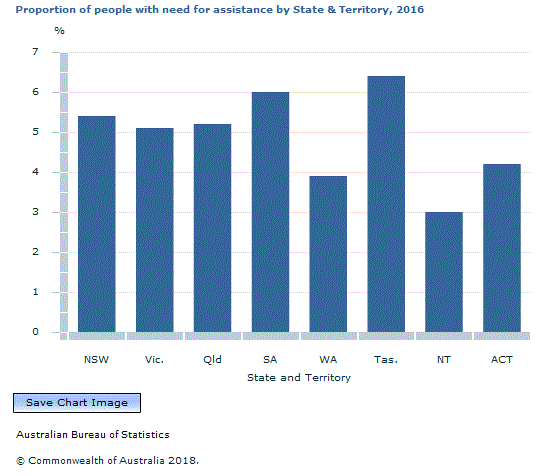 Source(s): ABS Census of Population and Housing, 2016 As noted earlier, the need for assistance increases with age. While Tasmania had the highest median age and the Northern Territory and Western Australia had amongst the lowest, the pattern in relative prevalence of need for assistance with core activities was similar when the data was adjusted (or standardised) to remove the effects of the age structure of the different states and territories. Section of State In 2016, the population living in other urban areas (urban centres with a population between 1,000 and 99,999) had higher proportions of people with a need for assistance than major urban areas (with populations of 100,000 or more). Across Australia, 6.4% of people living in other urban areas needed assistance compared with 4.9% of people in major urban areas. This pattern occurred in all states and territories. For example, 6.8% of people (98,900) living in other urban areas in New South Wales had a need for assistance compared with 5.1% of people (270,500) living in major urban areas. 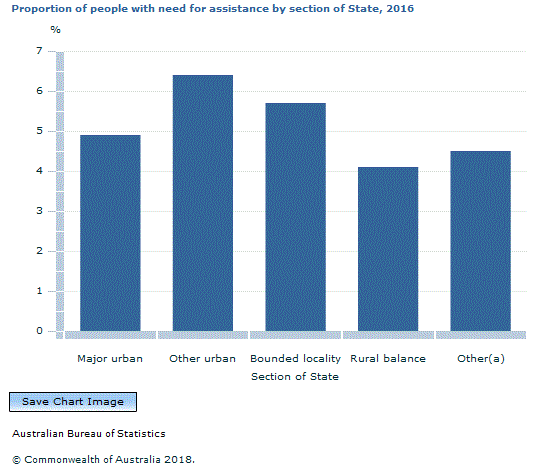 Footnote(s): (a) ‘Other’ includes migratory, offshore, shipping and no usual address. Source(s): ABS Census of Population and Housing, 2016 LIVING ARRANGEMENTS OF PEOPLE WITH NEED FOR ASSISTANCE Most people who needed assistance lived in a private household (86%), either with other people or alone. Of those people living in private households, the most common living arrangement was living with a family (78% of people who needed assistance), followed by living alone (18%). Females in private households who needed assistance were more likely to be living alone (23% or 115,200 people) than males (14% or 65,000 people). More than three quarters of the females (76% or 87,400 people) needing assistance and living alone were aged 65 years or older, compared with just over half the males (53% or 34,200 people) in the same situation. People with a need for assistance in private households were almost twice as likely to be living alone in 2016 (18% or 180,200 people) compared with people who didn’t need assistance (9.2% or 1.8 million people).  by need for assistance, 2016.GIF) Footnote(s): (a) Excludes people who weren't at home on Census night. Includes households in occupied private dwellings only, excluding visitor only and non-classifiable households. Source(s): ABS Census of Population and Housing, 2016 Approximately 14% of people who needed assistance lived in non-private dwellings in 2016 – 23% of people aged 65 years and over. The most common types of non-private dwellings were nursing homes (64% of people in non-private dwellings who needed assistance) and accommodation for the retired or aged (not self-contained) (27%). Almost all people (96%) in these two types of accommodation were aged 65 years and over. CULTURAL DIVERSITY AND THE NEED FOR ASSISTANCE English proficiency and language spoken at home Of those who needed assistance in 2016, three in every four people (75% or 904,300) spoke only English at home. Some 7.6% (92,000) of people with a need for assistance did not speak English well, while 3.1% (37,100) did not speak English at all. Despite the population who did not speak English at all making up a small proportion of all people needing assistance, a comparatively high proportion of people who did not speak English at all indicated need for assistance (19%). One in every seven people who did not speak English well (15%) also needed assistance. This compares with 2.5% of the population who spoke English very well and who needed assistance.  Source(s): ABS Census of Population and Housing, 2016 The prevalence of needing assistance with core activities varied depending on the languages spoken at home. Looking at the most commonly spoken languages, we can see the need for assistance was highest amongst people speaking Italian (15%) and Greek (12%) in 2016 and lowest amongst people speaking Punjabi (1.5%). Much of this variation is explained by the age of the populations speaking these languages. Australians speaking Italian and Greek, for example, tend to be older, with median ages of 58 and 49 years respectively, in contrast to Punjabi-speaking Australians who have a median age of 29 years. While age is one component, there are clearly other factors contributing to whether people need assistance with core activities. For example, Arabic-speaking Australians are relatively young, with a median age of 31 years, but have a high level of need for assistance at 8.5%.  Footnote(s): (a) Includes all other languages, languages not identified individually, ‘inadequately described’, ‘non-verbal, so described’ and ‘not stated’. Source(s): ABS Census of Population and Housing, 2016 Aboriginal and Torres Strait Islander People Despite having a much younger age profile than non-Indigenous people, a higher proportion of Aboriginal and Torres Strait Islander people reported a need for assistance in 2016 (6.7% compared with 5.3% of the non-Indigenous population). When the age differences between the Aboriginal and Torres Strait Islander and non-Indigenous populations were taken into account, Aboriginal and Torres Strait Islander people were almost twice as likely to need assistance with core activities (8.5% compared with 4.7% of the non-Indigenous population). Furthermore, the proportion of Aboriginal and Torres Strait Islander people who reported a need for assistance increased from 5.4% in 2011 to 6.7% in 2016. However, this may be influenced by a range of factors including changes in propensity to identify as Aboriginal and Torres Strait Islander origin between Censuses. For further information please see Aboriginal and Torres Strait Islander Population, 2016 (cat. no. 2071.0) and Census of Population and Housing: Characteristics of Aboriginal and Torres Strait Islander Australians, 2016 (cat. no. 2076.0). WORK, EDUCATION and QUALIFICATIONS OF PEOPLE WITH NEED FOR ASSISTANCE Employment, unemployment and the need for assistance The proportion of people with need for assistance who were employed increased from 7.7% in 2011 to 8.6% in 2016. For people aged 15 to 64 years who needed assistance, the proportion employed increased from 16% in 2011 to 18% in 2016. Of people in the labour force with a need for assistance in 2016 (108,300 people), one in six were unemployed (16% or 17,800 people). This is compared with one in fifteen people (6.8% or 759,300 people) of the 11.2 million people who did not have a need for assistance. People with a need for assistance and in the labour force were more likely to be working part-time than people who did not have a need for assistance (46% compared with 30%). 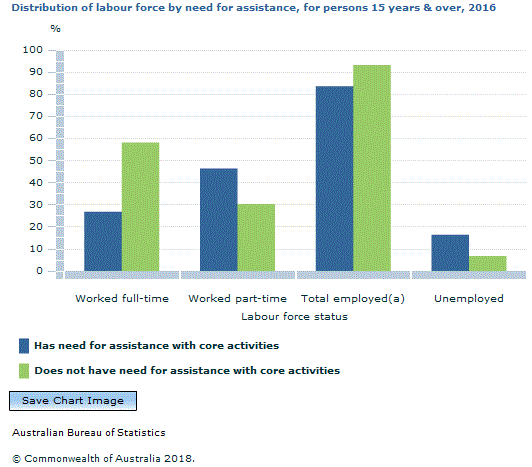 Footnote(s): (a) Includes those employed away from work. Source(s): ABS Census of Population and Housing, 2016 Occupation People who needed assistance worked across a variety of occupations in 2016. Almost one in four employed people (24%) with a need for assistance worked as a labourer in 2016. This was higher for men – almost one-third of men who needed assistance were labourers (30%). The most common labouring occupations for men who needed assistance were factory process workers (4,900 people), followed by other labourers, and cleaners and laundry workers (2,600 people each). Other common occupation groups for men who had a need for assistance were technicians and trades workers (15%), managers and professionals (both 11%). For employed women with a need for assistance, the top three occupation groups were clerical and administrative workers (23%), professionals (19%) and labourers (18%). The most common clerical occupations for women with a need for assistance were general clerks and receptionists. People who did not need assistance had a different occupation profile. The most common occupation group for women who did not need assistance was professionals (26%) and for men it was technicians and trades workers (22%). Labourers were one of the least common occupations for people who did not need assistance (12% of men and 7.0% of women), in contrast to people who needed assistance.  by need for assistance, 2016.GIF) Footnote(s): (a) Not stated and inadequately described populations excluded from the total when calculating proportions. Source(s): ABS Census of Population and Housing, 2016 Education At first glance, people who had a need for assistance were less likely to be studying. Some 13% of people with a need for assistance attended an educational institution in 2016 (151,200 people), compared with 26% of those without a need for assistance (5.3 million people). However, this gap was very small when the data was adjusted to remove the effects of the different age structure for people who did and did not need assistance (26% and 27% respectively). The higher rate of educational attendance was only evident in the younger age group. Children under 15 years of age with a need for assistance were more likely to be students than children the same age who did not need assistance. This difference comes from a higher proportion of 3 and 4 year old children with a need for assistance attending preschool than children who do not need assistance. Young children with disabilities may be able to access early intervention preschool services in many locations which may contribute to the difference in attendance rates at this age. The story was reversed for people aged 15 to 24 years however, as people with a need for assistance were less likely to be attending an educational institution than those who did not need assistance. By the time people reached the 25 to 34 year age group, the difference in educational attendance rates between those who had a need for assistance and those who did not need assistance had reduced substantially. 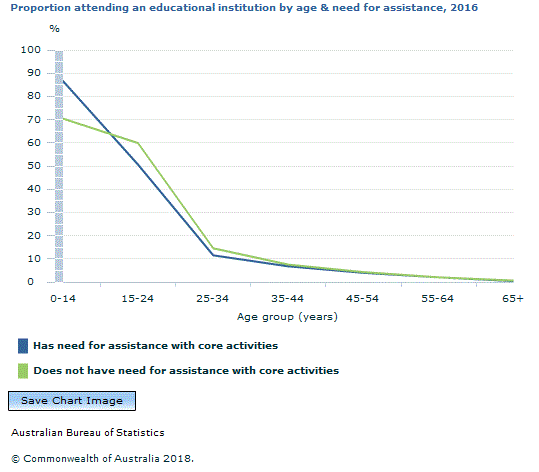 Source(s): ABS Census of Population and Housing, 2016 Of all students in 2016, people with a need for assistance were less likely to be at a university or other tertiary institution (6.5%) than those people who did not have a need for assistance (22%). The proportions attending secondary school were reasonably close for students with and without a need for assistance (28% and 26% respectively). Three-quarters of secondary school students with a need for assistance (73%) were attending a government school compared with half (57%) of those without a need for assistance. Non-school qualifications In 2016, people with a need for assistance were half as likely to have obtained non-school qualifications as people who did not have a need for assistance (31% compared with 57%). This lower rate of non-school qualifications was present across all groups. When comparing those with a need for assistance and those without, the gap between the proportions of people with a non-school qualification was largest amongst people aged 25-44 years and reduced with age. This apparent reduction of the gap with age is partly due to people who obtained a non-school qualification when they were younger, subsequently developing a need for assistance as they age. It also reflects the fact that older people in general are less likely to have non-school qualifications than younger people.  by age and need for assistance, 2016.GIF) Footnote(s): (a) The 'not stated' category was excluded and the 'inadequately described' category was included in the total when calculating proportions. Source(s): ABS Census of Population and Housing, 2016 For people aged 15 years and over and who continued on to further study, the most common highest non-school qualification was certificate level. Half of people (52%) with a need for assistance who had gained a non-school qualification, and one-third of people (37%) who did not have a need for assistance had achieved a certificate as their highest non-school level qualification.  for persons 15 years and over by need for assistance, 2016.GIF) Footnote(s): (a) The 'not stated' category was excluded from the total when calculating proportions. Source(s): ABS Census of Population and Housing, 2016 EXPLANATORY INFORMATION People who did not state their need for assistance were included in the denominator when calculating the proportion of people with a need for assistance. One in fourteen people (7.1%) did not state if they had a need for assistance in 2016, which was an increase from 5.7% of the population in 2011. Age standardised rates have been used where noted in the article. An age standardised rate is calculated to remove the effects of different age structures when comparing populations over time. A standard age composition is used, in this case the age composition of the estimated resident population of Australia at 30 June 2001. An age standardised rate is that which would have prevailed if the actual population had the standard age composition. Major urban represents a combination of all Urban centres with a population of 100,000 or more. Other urban represents a combination of Urban centres with a population between 1,000 and 99,999. Bounded localities represent a combination of all Bounded localities. Rural balance represents the remainder State/Territory. See the Australian Statistical Geography Standard (ASGS) for more information. Four Census questions are used to capture data for this variable. For more information, see Census of Population and Housing: Understanding the Census and Census data, 2016 (cat. no 2900.0). For definitions of the terms used above, see the Census of Population and Housing: Census Dictionary, 2016 (cat. no. 2901.0). Selected items are also included in the Glossary, from the Explanatory Notes tab at the top of this page. For more information about 2016 Census data release and products, go to www.abs.gov.au/census. Data contained in this article and further related data can be found in the Downloads tab at the top of the page. Document Selection These documents will be presented in a new window.
|
|
2071.0 - Census of Population and Housing: Reflecting Australia - Stories from the Census, 2016
ARCHIVED ISSUE Released at 11:30 AM (CANBERRA TIME) 19/04/2018

This page last updated 21 March 2023