Page tools:
 Print Page Print Page
 Print All Print All
| ||||||||||||||||||||||||||||||||||||||||||||||||||||||||||||||||||||||||||||||||||||||||||||||||||||||||||||||||||||||||||||||||||||||||||||||||||||||||||||||||||||||||||||||||||||||||||||||||||||||||||||||||||||||||||||||||||||||||||||||||||||||||||||||||||||||||||||||||||||||||||||||||||||||||||||||||||||||||||||||||||||||||||||||||||||||||||||||||||||||||||||||||||||||||||||||||||||||||||||||||||||||||||||||||||||||||||||||||||||||
|
SAME-SEX COUPLES IN AUSTRALIA, 2016 Australian families are characterised by increasing diversity - including a rise in the number of same-sex couple families.1 The Census of Population and Housing captures information on same-sex couples based on responses to the relationship and sex questions on the Census form. Counts of same-sex couples living together in the same household have been compiled since the 1996 Census. The Census tells us how many same-sex couples live together, as well as the information about characteristics of people in same-sex couple relationships, such as their age, education, income levels and cultural diversity. However, there are some limitations associated with same-sex couple data from the Census that need to be considered:
NUMBER OF SAME-SEX COUPLES LIVING TOGETHER The 2016 Census counted just under 46,800 same-sex couples living together in Australia. This represents a 39% increase since the 2011 Census, which counted 33,700 same-sex couples. Data on same-sex couples first became available in 1996. In the 20 years to 2016, the reported number of same-sex couples has more than quadrupled. The increase in the reported number of same-sex couples may in part reflect greater willingness by people to identify themselves as being in a same-sex relationship and an improvement over the last 20 years in the rights of same-sex couples.2 Younger people accounted for almost all of the increase in the number of same-sex couples between the 2011 and 2016 Censuses. Half (51%) of the increase was for the cohort aged 20-29 years in 2016, with an additional 35% of the increase in the cohort aged 30-39 years in 2016.  Footnote(s): (a) For the 2011 Census, age has been adjusted so that it is the expected age at the time of the 2016 Census, to enable comparisons of the same age cohort between Censuses. See Explanatory Information at the end of this article. Source(s): ABS Census of Population and Housing, 2011 and 2016. In 2016, there were 23,700 male same-sex couples and 23,000 female same-sex couples. The pattern of more male than female same-sex couples has been consistent since 1996, although the degree of difference has decreased in each Census. Same-sex couples accounted for 0.9% of all couples in Australia, up from 0.7% in 2011.  Source(s): ABS Census of Population and Housing, 1996 - 2016. WHERE DO SAME-SEX COUPLES LIVE? In 2016, same-sex couples accounted for 1.4% of all couples in the Australian Capital Territory, the highest proportion of any state or territory. The next highest proportions were in New South Wales and Victoria, where same-sex couples accounted for 1.0% of couples. Almost two-thirds (63%) of same-sex couples lived in New South Wales or Victoria, compared to 57% of all couples.
(a) Same-sex couples in that State/Territory as a proportion of all same-sex couples in Australia. (b) Same-sex couples as a proportion of all couples in that State or Territory. (c) Total for Australia includes Other Territories. Source: ABS Census of Population and Housing, 2011 and 2016. Same-sex couples were more likely to live in capital cities than outside capital cities. Same-sex couples accounted for 1.1 % of all couples in the capital cities, compared with 0.6% of all couples in the balance of the States and Territories. The proportion of same-sex couples was highest in Canberra and Sydney (1.4% and 1.2 % respectively) and lowest in Adelaide and Perth (both 0.8%). Both male and female same-sex couples tended to live in inner-city suburbs of capital cities. The top ten suburbs for male same-sex couples were all in inner Sydney. Female same-sex couples tended to be more geographically dispersed and less concentrated than male same-sex couples. While seven of the top ten suburbs for female same-sex couples were in inner Sydney, suburbs from Newcastle, Port Adelaide and a small town in Victoria rounded out the top 10.
(a) Suburbs with less than a total of 250 couples excluded. (b) As a proportion of all couples. Source: ABS Census of Population and Housing, 2016. AGE OF PARTNERS IN SAME-SEX COUPLES People in same-sex couples tended to be younger than people in opposite-sex couples. The median age of people in same-sex couples was 40 years compared with 48 years for people in opposite-sex couples. In 2016, almost three quarters (73%) of people in same-sex couples were aged less than 50 years old, compared with 53% of people in opposite-sex couples. Only 5.3% of people in same-sex couples were aged 65 or more, compared with 20% of people in opposite-sex couples. The difference in the reported number of same-sex couples in older age groups may in part reflect the willingness of people aged 65 years or over to identify themselves as being in a same-sex relationship. AGE OF PARTNERS IN COUPLES BY SEX, 2016 Source: ABS Census of Population and Housing, 2016. Since 1996, the populations of both opposite-sex and same-sex partners have aged; and so too has the whole Australian population. The proportion of partners in same-sex couples aged 50 years and over increased from 9.2% in 1996 to 27% in 2016 (compared with the general population, increasing from 26% to 34%). This increase may reflect people's increased willingness to disclose their sexual or gender identity, coupled with improved legal rights for same-sex couples and the ageing of the 'baby boomer' population.3 AGE OF PARTNERS IN SAME-SEX COUPLES BY SEX, 1996 and 2016 Source: ABS Census of Population and Housing, 1996 and 2016. Age differences between partners Same-sex couples tended to have a greater age gap between partners than opposite-sex relationships. There was an age difference of more than 10 years between partners in 25% of male same-sex couples and 14% of female same-sex couples, compared with only 8% of opposite-sex couples.  by Type of Couple, 2016.GIF) Footnote(s): (a) Only includes households where both partners were present on Census night. Source(s): ABS Census of Population and Housing, 2016. RELATIONSHIP REPORTED Consistent with 2011, almost all same-sex couples described themselves as de facto partners (93%). However, there has been an increase in the reporting of same-sex marriage. Between 2011 and 2016, the number of same-sex couples who reported that they were married more than doubled.
Source: ABS Census of Population and Housing, 2016. The reasons why people in Australia might report that they are the husband or wife of someone of the same sex cannot be known from Census data. Possible reasons include having been married in a jurisdiction other than Australia; having registered their relationship under state or territory law; having gone through a ceremony; regarding themselves as married; or considering that husband or wife is the term that best describes their relationship. FAMILIES AND CHILDREN Like the majority of Australian families (95%), most same-sex couples lived in a single family household (98%). The proportion of same-sex couple families with children increased from 12% in 2011 to 15% in 2016. As was the case in 2011, female same-sex couples were more likely to have children than male same-sex couples. In 2016, one quarter (25%) of female same-sex couples had children, compared with 4.5% of male same-sex couples. Close to 55% of opposite-sex couples had children. Same-sex couples with children, on average, had fewer children living with them than opposite-sex couples. Over half of male and female same-sex couples with children had only one child in the family (54% and 51% respectively), while one third had two children. In contrast, opposite-sex couples were less likely to have one child than two children in their family (36% compared with 42%). In total, there were 10,500 children aged under 25 years living in same-sex couple families in 2016. Of these, 80% were children aged under 15 years of age, 12% were dependent students, and 7.2% were non-dependent children aged 15-24 years. Children in same-sex couple families accounted for 0.2% of all dependent children in families. The Census does not collect information on people's sexual orientation. Therefore information from the Census does not provide a complete picture of families consisting of lesbians or gay men and their children. Lesbians or gay men who are lone parents are not identified in Census data although they would be included in the total counts of lone parents. Other aspects of parenting such as parents who are not usually resident in the same household as the child are not captured in the Census.
(a) People whose relationship in household is natural or adopted child, step child, foster child, otherwise related child under 15 years (excluding grandchildren) and unrelated children under 15 years. (b) Dependent students are children aged 15–24 years of age in full-time education. (c) Non-dependent children are aged 15 years and over and not in full-time education. Source: ABS Census of Population and Housing, 2016. CULTURAL CHARACTERISTICS In 2016, about 146,800 Aboriginal and Torres Strait Islander people were living with a partner and, of these, 1.2% (about 1,700 people) were living with a partner of the same sex. In comparison, of the 9.5 million non-Indigenous people living with a partner, 0.9% were living with a partner of the same sex. However, the Aboriginal and Torres Strait Islander population has a much younger age profile than the non-Indigenous population and if adjustments are made for these age differences, the same proportion of non-Indigenous and Aboriginal and Torres Strait Islander people were partnered with someone of the same sex (0.9%). People born overseas were less likely to report they were living with a partner of the same sex (0.8%), than people born in Australia (1.0%). Religious affiliation People in same-sex couples were most likely to report they had no religion (57%), however, 32% said they were Christian. This was in contrast to people in opposite-sex couples, for whom Christianity was the leading affiliation (59%), followed by not having a religion (28%). This may be partly due to the large number of young people reporting they were in a same-sex relationship and the greater likelihood of younger people reporting no religion.4 The proportion of people in same-sex and opposite-sex couples who had no religion also increased between 2011 and 2016. This figure was up from 48% in 2011 to 57% for people in same-sex couples and up from 21% in 2011 to 28% in 2016 for people in opposite-sex couples. Same-sex partners were more likely to be affiliated with Buddhism than those in opposite-sex couples (3.9% compared with 2.7%) and less likely to be affiliated with Hinduism (0.5% compared with 2.4%) or Islam (0.7% compared with 2.4%).  Footnote(s): (a) No religion includes secular beliefs (e.g. Atheism) and other spiritual beliefs (e.g. New Age). (b) Other religions include Buddhism, Hinduism, Islam, Judaism and other religions. Source(s): ABS Census of Population and Housing, 2016. EDUCATION Of all partners in couples in 2016, same-sex couples were more likely to be currently studying at a university or tertiary institution (7.6%) than opposite-sex couples (2.9%). Subsequently, people in same-sex couples tended to be more highly educated than people in opposite-sex couples. In 2016, 45% of people in same-sex couples had a Bachelor degree or higher, compared with 29% of people in opposite-sex couples. People in same-sex couples were also more likely to have a postgraduate degree than people in opposite-sex couples (12.4% compared with 6.8%). However, this may be a reflection of the younger age profile of same-sex couples and higher educational attainments of more recent generations compared to older groups. .GIF) Footnote(s): (a) Total with qualifications excludes Level of Education not stated. Source(s): ABS Census of Population and Housing, 2016. WORK Same-sex couples were more likely to participate in the labour force and be employed, than opposite-sex couples. This is in part due to the younger age profile of same-sex couples. In 2016, 87% of people in same-sex couples were participating in the labour force (either employed or unemployed), compared with 69% of opposite-sex couples. For those of working age (15-74 years), these figures were 88% and 74% respectively. The percentage employed was 84% for people in same-sex couples, significantly higher than opposite-sex couples (67%). Male and female partners in same-sex couples participated in the labour force at similar rates (87% and 86%). The proportion of people employed was also similar (84% for male partners and 83% for female partners, in same-sex couples). In contrast, male partners in opposite-sex couples were more likely to participate in the labour force than women (75% and 64%). Similarly, male partners were also more likely to be employed than female partners in opposite-sex couples (72% and 61%). Occupation Over half of employed people in same-sex couples worked as managers or professionals (51%), compared with 40% of people in opposite-sex couples.  Source(s): ABS Census of Population and Housing, 2016. In 2016, the most common occupations for men in same-sex couples were Retail manager and Sales assistant, with the next common occupations being Advertising, public relations and sales managers and Registered nurses. Other occupations in the top ten for men in same-sex couples included General clerks, Advertising and marketing professionals, Hairdressers, and Cafe/restaurant managers, while trades such as Electricians, Carpenters and joiners and Motor mechanics were well represented for men in opposite-sex couples. For women in same-sex couples, the most common occupation was Registered nurse, with the next most common occupations being Sales assistant; Retail manager and Secondary school teacher. Police, Welfare workers and Aged and disabled carers featured in the top ten occupations of women in same-sex couples but not opposite-sex couples, with teaching and clerical occupations being common across both groups.
(a) Occupation data based on 4 digit level. Source: ABS Census of Population and Housing, 2016. INCOME People in same-sex couple relationships were more likely to have higher personal incomes than those in opposite-sex couple relationships. In 2016, 23% of men in same-sex couples earned $2,000 or more a week, compared with 18% of men in opposite-sex couples. For women, the difference was greater. Women in same-sex couples were twice as likely to be earning $2,000 or more a week as women in opposite-sex couples (14% compared with 6%). A much higher proportion of women in same-sex relationships earned $2,000 or more a week than women in opposite-sex relationships during the peak income earning years from 30 to 64. This in part reflects the greater likelihood of women in opposite-sex relationships to leave the workforce (either temporarily or permanently) to have children, or the higher average number of children they have compared to same-sex couples. Nearly two-thirds (64%) of opposite-sex couples with children had two or more children living in the family, compared with 49% of female same-sex couples with children.  Source(s): ABS Census of Population and Housing, 2016. 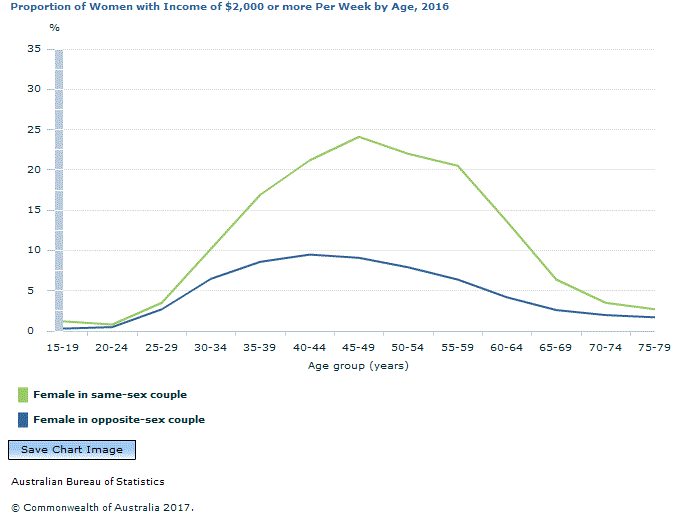 Source(s): ABS Census of Population and Housing, 2016. DWELLING TENURE In 2016, same-sex couple families were more likely to live in a dwelling that was being rented (39%) than opposite-sex couple families (23%). However, they were less likely to live in a dwelling that was owned outright (16% of same-sex couple families compared to 31% of opposite-sex couple families). This difference can partly be attributed to the younger age profile of same-sex couples, but might also be related to where they live and their housing choices.  of Couples, 2016.GIF) Footnote(s): (a) Includes households in occupied private dwellings only. Excludes visitor only and non-classifiable households. (b) Owned with a mortgage includes ‘Being rented under a shared equity scheme’. (c) Rented includes ‘Being occupied rent free’. Source(s): ABS Census of Population and Housing, 2016. UNPAID WORK In same-sex couples, unpaid domestic work was more evenly shared between partners. In female same-sex couples, 57% of partners did about the same amount of work, and for male same-sex couples this figure was 56%. In opposite-sex couples, women tend to do more unpaid work than men. In 2016, women did more unpaid domestic work than men in 54% of opposite-sex couples, compared with 7.3% of couples where men did more domestic work than women, and 39% where partners did the same amount of domestic work. , 2016.GIF) Footnote(s): (a) Couples in which both partners reported amount of unpaid work within the same range on the Census form. Source(s): ABS Census of Population and Housing, 2016 Consistent with the more even sharing of household work, men in same-sex couples did slightly more unpaid domestic work than men in opposite-sex couples (52% and 49% respectively did five hours or more per week). Women in same-sex couples did less unpaid work than women in opposite-sex relationships (61% and 78% respectively did five hours or more per week). However, women in same-sex relationships still tended to do more unpaid domestic work than men in same-sex relationships. EXPLANATORY INFORMATION All data presented on a Place of Enumeration basis. This article presents information on the number and characteristics of people in same-sex couple relationships who lived together in the same private dwelling, as reported in the 2016 Census of Population and Housing. All data in this article relates to people aged 15 years and over. In this article counts of 'same-sex couples' are counts of the family unit, while counts of 'partners or people in same-sex couples' are counts of individuals. In the Census, partners in couples must be aged 15 years and over. For definitions of the terms used above, see the Census of Population and Housing: Census Dictionary, 2016 (cat. no. 2901.0). Selected items are also included in the Glossary, from the Explanatory Notes tab at the top of this page. For more information about 2016 Census data release and products, go to www.abs.gov.au/census. Data contained in this article and further related data can be found in the Downloads tab at the top of the page. Age cohort analysis was used in the section of this article 'Number of same-sex couples living together'. This analysis enables direct comparison of people within the same age cohort (e.g. 25 years at the time of the 2016 Census). The 2011 Census age was adjusted so that it was the expected age of each person at the time of the 2016 Census (i.e. age at the time of the 2011 Census plus five years). The 2016 Census age was not adjusted. How are same-sex couples counted in the Census? All couples and other types of families and households in private dwellings are identified in Census data through answers to questions on each person’s relationship to Person 1 on the Census form. The question on whether the person is male or female is also relevant as this will determine whether two people are classified as an opposite-sex or same-sex couple. The Census only measures relationships in each household which means we don't count those relationships which extend beyond the household. This applies to both same-sex and opposite-sex couples.
A separate question on each person's registered marital status is included on the 2016 Census Household Form, but this is not used to classify people into families. This is because people's registered marital status may or may not relate to a person they are living with. Document Selection These documents will be presented in a new window.
|
|||||||||||||||||||||||||||||||||||||||||||||||||||||||||||||||||||||||||||||||||||||||||||||||||||||||||||||||||||||||||||||||||||||||||||||||||||||||||||||||||||||||||||||||||||||||||||||||||||||||||||||||||||||||||||||||||||||||||||||||||||||||||||||||||||||||||||||||||||||||||||||||||||||||||||||||||||||||||||||||||||||||||||||||||||||||||||||||||||||||||||||||||||||||||||||||||||||||||||||||||||||||||||||||||||||||||||||||||||||
2071.0 - Census of Population and Housing: Reflecting Australia - Stories from the Census, 2016
ARCHIVED ISSUE Released at 11:30 AM (CANBERRA TIME) 18/01/2018

This page last updated 21 March 2023