4670.0 - Household Energy Consumption Survey, Australia: Summary of Results, 2012
ARCHIVED ISSUE Released at 11:30 AM (CANBERRA TIME) 24/09/2013 First Issue
Page tools:
 Print Page Print Page
 Print All Print All
| ||
|
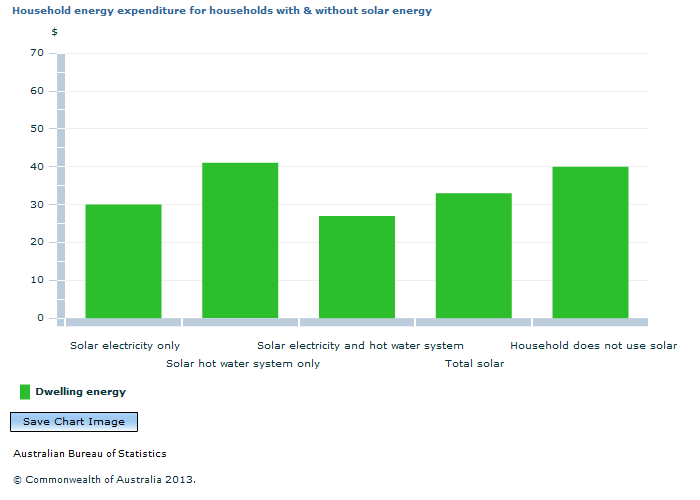
DWELLING CHARACTERISTICS Energy expenditure and consumption The following section provides information on differences in household energy use across dwellings with varying characteristics. It should be noted that household sizes, compositions and energy-related behaviours are also likely to vary in accordance with dwelling characteristics, and in some cases will contribute to observed differences between dwelling characteristics. Households living in separate houses had significantly higher energy costs per week than other types of dwellings. The average energy costs among separate houses was $109 per week, while for semi-detached, row or terrace houses or townhouses it was $70 per week and for flats, units or apartments it was $59 per week. Both expenditure on dwelling energy and fuel for vehicles, and units consumed of electricity and mains gas followed similar patterns according to dwelling type. (Endnote 1) .gif) The total dwelling energy expenditure and the units of energy consumed by households did not significantly differ with the age of dwelling, ranging between $38 and $40). This is likely to be influenced by a combination of such factors as the number of people and bedrooms in the dwelling (both generally decreased with the age of dwelling) which may influence levels of consumption, along with more energy efficiency related characteristics. Expenditure on energy within dwellings was lower among households with either a solar electricity system, hot water systems or both systems ($33 per week) compared to households who did not use solar ($40 per week). Overall most of the difference was driven by dwellings with solar energy having lower electricity costs ($25 compared to $30 per week), however these dwellings also had lower average gas expenditure ($8 compared to $9 per week).  For households with solar electricity (with or without a solar hot water system) energy costs for the dwelling were at least $10 per week lower on average than households who had only a solar hot water system, or no solar system at all. Units of electricity consumed each week within the dwelling did not differ significantly between households with solar systems (electricity or hot water) and those without (130.3 kilowatt hours (kWh) and 122.3 kWh on average respectively). This indicates the financial benefit of having a solar system - despite different expenditures, the units of electricity consumed were similar. Weekly electricity consumption however, was higher among those who had a solar hot water system only (146.4 kWh), compared to those with solar electricity, or who did not use solar (around 120 kWh). Consumption of mains gas and LPG/ bottle gas for households with and without solar systems is a factor of both the prevalence of solar systems in a region, and the availability or usage of LPG/ bottled gas in an area. Households in the northern parts of Australia, for instance, have higher rates of solar systems but less access to mains gas, while the opposite is the case for southern parts of Australia. Accordingly, the average weekly megajoules (MJ) of mains gas consumed were significantly higher among households without a solar system (electricity or hot water, 678.4 MJ) compared to households with a solar system (551.7 MJ). LPG/ bottled gas, which is likely to vary in its usage across the country, did not significantly differ in consumption between households with or without solar (6.7 and 7.6 litres (L) respectively). Households with only solar electricity installed consumed significantly more LPG/bottled gas (10.2 L) than households with a solar hot water system only installed (3.2 L). (Endnote 1). Average expenditure on dwelling energy was significantly less for households with an electric hot water systems installed ($36 per week) compared to households with a mains gas or LPG/ bottled gas hot water system ($44 and $45 per week, respectively) (Endnote 2). Electricity costs and units consumed were significantly higher for households with an electric hot water system ($32 and 140.3 kWh per week) compared to those with a mains gas system ($26 and 101.7 kWh per week). However, there was no significant difference in electricity costs or units consumed between households with an electric hot water system and a LPG/ bottled gas system ($29 and 136.1 kWh). There were no significant differences between either the electricity expenditure or units consumed for households with continuous or off-peak electric hot water systems ($31 and 128.1 kWh and $32 and 152.3 kWh, respectively). Endnotes 1. Information on units of electricity and gas were only supplied by households who could locate this information on a bill or statement. The rate of households who supplied consumption information varied, but ranged between 60% and 68% for electricity, 52% and 69% for households with mains gas and 79% and 91% for households with LPG/ bottled gas. 2. A very small number of households reported having both an electric hot water system and a mains gas or LPG/ bottled gas hot water system. Document Selection These documents will be presented in a new window.
|
|
