EXPLANATORY NOTES
INTRODUCTION
1 The statistics presented in this publication were compiled from data collected on Learning and Work through the Australian Bureau of Statistics' (ABS) 2010–11 Multipurpose Household Survey (MPHS). The MPHS is conducted each financial year throughout Australia from July to June as a supplement to the ABS' monthly Labour Force Survey (LFS) and is designed to provide annual statistics for a number of small, self–contained topics.
2 In 2010–11 the topics were:
3 For all topics, general demographic information such as age, sex, labour force characteristics, education and income are also available.
4 This publication presents details from individuals about their non-school qualification history including the level and field of each qualification and year of completion. Information was also collected on the impact of each qualification on a person's working life six months after completion and the relevance of the main field of study of each qualification to a person's current job. Another focus of the publication is the characteristics of migrants, with data collected on Australian citizenship, language spoken at home, English proficiency, year of arrival, and level and field of highest non–school qualification before and after arrival in Australia. There are no time series data available as this is the first release of the topic. Note that any reference to qualifications in this publication relates to non-school qualifications.
5 It is expected that Learning and Work data will again being collected in the MPHS for the reference period 2014–15.
SCOPE
6 The scope of the LFS is restricted to people aged 15 years and over and excludes the following:
- members of the permanent defence forces
- certain diplomatic personnel of overseas governments, customarily excluded from census and estimated resident populations
- overseas residents in Australia
- members of non–Australian defence forces (and their dependants).
7 In addition, the 2010–11 MPHS excluded the following from its scope:
- people living in very remote parts of Australia
- people living in non–private dwellings such as hotels, university residences, students at boarding schools, patients in hospitals, residents of homes, (e.g. retirement homes, homes for persons with disabilities, women's shelters), and inmates of prisons.
8 As indicated above, the scope of the 2010–11 MPHS excluded persons living in very remote parts of Australia. The exclusion of people living in these areas is unlikely to impact on state and territory estimates, except in the Northern Territory where they account for approximately 23% of the total population.
COVERAGE
9 The coverage of the 2010–11 MPHS was the same as the scope, except that persons living in Indigenous communities in non–very remote areas were not covered for operational reasons.
10 In the LFS, rules are applied which aim to ensure that each person in coverage is associated with only one dwelling and hence has only one chance of selection in the survey. See
Labour Force, Australia (cat. no. 6202.0) for more details.
DATA COLLECTION
11 The MPHS was conducted as a supplement to the monthly LFS. Each month one eighth of the dwellings in the LFS sample were rotated out of the survey. Generally, around 80% of these dwellings were then selected for the MPHS each month. In these dwellings, after the LFS had been fully completed for each person in scope and coverage, a person aged 15 years or over was selected at random (based on a computer algorithm) and asked the various MPHS topic questions in a personal interview. If the randomly selected person was aged 15–17 years, permission was sought from a parent or guardian before conducting the interview. If permission was not given, the parent or guardian was asked the Learning and Work history questions on behalf of the 15–17 year old. Data was collected using Computer Assisted Interviewing (CAI), whereby responses were recorded directly onto an electronic questionnaire in a notebook computer, usually during a telephone interview.
12 For the 2010–11 MPHS, the sample was accumulated over a 12 month period from July 2010 to June 2011.
13 The publication Labour Force, Australia (cat. no. 6202.0) contains definitions of demographic and labour force characteristics, and information about telephone interviewing that is relevant to both the monthly LFS and MPHS.
SAMPLE SIZE
14 The sample size may vary for different topics in the MPHS. The initial sample for the Learning and Work topic was 20,121 private dwellings, from which one person was randomly selected. Of the 17,198 private dwellings that remained in the survey after sample loss (for example, dwellings selected in the survey which had no residents in scope for the LFS, vacant or derelict dwellings and dwellings under construction), 13,366 or 78% fully responded to the questions on Learning and Work.
ESTIMATION METHOD
Weighting
15 Weighting is the process of adjusting results from a sample survey to infer results for the total in–scope population. To do this, a 'weight' is allocated to each sample unit, which, for the MPHS can be either a person or a household. The weight is a value which indicates how many population units are represented by the sample unit. For the MPHS, the first step in calculating weights for each unit was to assign an initial weight, which is the inverse of the probability of being selected in the survey. For example, if the probability of a person being selected in the survey was 1 in 600, then the person would have an initial weight of 600 (i.e. they represent 600 people).
Benchmarking
16 The initial weights were then calibrated to align with independent estimates of the population of interest, referred to as 'benchmarks', in designated categories of age by sex by area of usual residence. Weights calibrated against population benchmarks ensure that the survey estimates conform to the independently estimated distribution of the population rather than the distribution within the sample itself. Calibration to population benchmarks helps to compensate for over or under–enumeration of particular categories of persons/households which may occur due to either the random nature of sampling or non–response.
17 For person estimates, the MPHS was benchmarked to the projected population in each state and territory, excluding the population living in very remote areas of Australia, at 31 March 2011. For household estimates, the MPHS was benchmarked to independently calculated estimates of the total number of households in Australia. The MPHS estimates do not (and are not intended to) match estimates for the total Australian person/household populations obtained from other sources (which may include persons living in very remote parts of Australia).
Estimation
18 Survey estimates of counts of persons or households are obtained by summing the weights of persons or households with the characteristic of interest. Estimates of non–person counts (e.g. number of qualifications) are obtained by multiplying the characteristic of interest with the weight of the reporting person/household and then aggregating them.
RELIABILITY OF ESTIMATES
19 All sample surveys are subject to error which can be broadly categorised as either:
- sampling error
- non–sampling error.
Sampling error
20 Sampling error is the difference between the published estimates, derived from a sample of persons, and the value that would have been produced if the total population (as defined for the scope of the survey) had been included in the survey. For more information refer to the
Technical Note.
Non–sampling error
21 Non–sampling error may occur in any collection, whether it is based on a sample or a full count such as a census. Sources of non–sampling error include non–response, errors in reporting by respondents or recording of answers by interviewers and errors in coding and processing data. Every effort is made to reduce non–sampling error by careful design and testing of questionnaires, training and supervision of interviewers, and extensive editing and quality control procedures at all stages of data processing.
DATA QUALITY
INTERPRETATION OF RESULTS
22 Information collected in this survey is self–reported by respondents and hence may differ from that which might be obtained from other sources or via other methodologies. This factor should be taken into consideration when interpreting the estimates in this publication and when making comparisons with other data sources.
23 The tables about migrants (Tables 12–14) refer to people who were in the 15–64 year age range at the time of the survey and were at least 15 years of age when they arrived in Australia. Consequently, these tables exclude all migrants who were under 15 years of age on arrival (regardless of their age at the time of the survey) and those migrants who were both 15 years or over on arrival AND over 64 years of age at the time of the survey. For example, those migrants who were aged 44 years on arrival and arrived during the period 1991–2011 were in the 44–64 year age range at the time of the survey and therefore included in the data. Those migrants aged 44 years on arrival who arrived prior to 1991 were aged 65 years or over at the time of the survey and are consequently excluded from these data.
24 In addition, when considering the tables about migrants, it is important to note that they focus only on the highest qualification completed at particular periods or points in time (i.e. before arrival in Australia, after arrival and at the time of the survey). As a result, the total number of migrants with a qualification at the time of the survey is not the addition of migrants with a qualification before arrival and migrants with a qualification after arrival. For example, a migrant may have a highest qualification of a Bachelor degree before arrival in Australia (Table 12.1), and then have attained a highest qualification of a Certificate IV after arrival (Table 12.2). This means that in Table 12.3, showing the highest qualification at the time of the survey, the migrant will only be counted once, as overall, their highest qualification is the Bachelor degree. The total number of migrants aged 15–64 years with a qualification at the time of the survey is shown in Table 1.
25 The same concepts also apply to Tables 14.1 (before arrival), 14.2 (after arrival) and 14.3 (at the time of the survey) which focus on employed migrants. In addition, in Tables 14.1, 14.2 and 14.3, persons 'without a qualification' has a different meaning for each table. In Table 14.1, 'without a qualification' includes all migrants who have never attained a qualification and migrants who did not attain a qualification before arrival but attained a qualification after arrival. In Table 14.2, it includes all migrants who have never attained a qualification and migrants who did not attain a qualification after arrival but attained a qualification before arrival, and in Table 14.3, it includes all migrants who have never attained a qualification at the time of the survey.
26 Consequently, all tables about migrants must be considered separately.
27 If the year of arrival and the year the qualification was completed was the same, then the qualification was considered to have been completed after arrival in Australia.
DATA COMPARABILITY
28 The 2010–11 Learning and Work publication is the first issue of this publication; however, some comparisons can be made with other selected education and training publications.
Comparability with Adult Learning, 2006–07 MPHS
29 In the 2006–07 MPHS, an education and training topic was included, called Adult Learning (cat. no. 4229.0), which collected information about the recent learning experiences (including formal qualifications, non–formal training and informal learning) of people aged 25–64 years. The sample for Adult Learning was restricted to this age range to exclude people who were in the initial stages of education (to align with the European Adult Learning Survey). In the 2010–11 MPHS, the Learning and Work topic focused only on formal non–school qualifications, including qualification history, the impact of the qualifications on the respondent's working life and the relevance of the qualifications to the respondent's current occupation/industry. Due to the change in focus and the lack of similar data items, comparisons cannot be made between the two surveys.
Comparability with other education and training surveys
30 The Survey of Education and Training (SET) (cat. no. 6278.0) and the Survey of Education and Work (SEW) (cat. no. 6227.0) have some similarities with Learning and Work. Conducted annually, the SEW provides a range of indicators about educational participation and attainment, and data on people's transition between education and work. The SET is conducted every four years and provides data on the level and outcomes of an individual's education and training and also provides a more extensive education history. Similar to Learning and Work, the SET is based on a personal interview with those respondents selected in the survey. On the other hand, SEW is based on a household interview with any responsible adult who responds on behalf of all persons in scope in the household. For the SEW, there were 30,400 completed interviews in May 2009 while the SET had 23,800 completed interviews in the survey period from March to June 2009. Learning and Work has a smaller sample size with 13,366 completed interviews.
31 Most of the content included in the Learning and Work topic is similar to that collected in the SET. The additional information available from Learning and Work covers the relevance of the main field of study of the respondent's qualification(s) to their current job and whether the qualifications were completed in Australia. Most of the content included in Learning and Work is different to the content included in SEW.
32 Care should be taken when comparing data from different surveys that relate to education and training issues, due to the different scopes, definitions and methodologies used.
Comparability with monthly LFS Statistics
33 Due to differences in the scope and sample size of the MPHS and that of the LFS, the estimation procedure may lead to some small variations between labour force estimates from this survey and those obtained from the LFS.
Other methodological issues
34 In the interpretation of the results of the 2010–11 survey, consideration should be given to the representativeness of the sample. This is affected by the response rate and also the fact that the survey covers only people living in private dwellings.
CLASSIFICATIONS
35 Country of birth data are classified according to the Standard Australian Classification of Countries (Second Edition) (cat. no. 1269.0).
36 Industry data are classified according to the Australian and New Zealand Standard Industrial Classification (ANZSIC), 2006 (cat. no. 1292.0)
37 Occupation data are classified according to the Australian and New Zealand Standard Classification of Occupations, First Edition, 2006 (ANZSCO) (cat. no. 1220.0)
38 Education data are coded to the Australian Standard Classification of Education (ASCED), 2001 (cat. no. 1272.0). The ASCED is a national standard classification which can be applied to all sectors of the Australian education system including schools, vocational education and training and higher education. The ASCED comprises two classifications: Level of Education and Field of Education.
39 Level of Education is defined as a function of the quality and quantity of learning involved in an educational activity. There are nine broad levels, 15 narrow levels and 64 detailed levels. For detailed definitions of these levels see the Australian Standard Classification of Education (ASCED), 2001 (cat. no. 1272.0). Level of Education is only output at the broad level for the Learning and Work topic.
40 Field of Education is defined as the subject matter of an educational activity. Fields of education are related to each other through the similarity of subject matter, through the broad purpose for which the education is undertaken, and through the theoretical content which underpins the subject matter. There are 12 broad fields, 71 narrow fields and 356 detailed fields. For detailed definitions of these fields see the Australian Standard Classification of Education (ASCED), 2001 (cat. no. 1272.0). Field of Education is only output at the broad level for the Learning and Work topic.
LEVEL OF HIGHEST EDUCATIONAL ATTAINMENT
41 Level of highest educational attainment was derived from information on highest year of school completed and level of highest non–school qualification. The derivation process determines which of the 'non–school' or 'school' attainments is regarded as the highest. Usually the higher ranking attainment is self–evident, but in some cases some secondary education is regarded, for the purposes of obtaining a single measure, as higher than some certificate level attainments.
42 The following decision table is used to determine which of the responses to questions on highest year of school completed (coded to ASCED Broad Level 6) and level of highest non–school qualification (coded to ASCED Broad Level 5) is regarded as the highest. It is emphasised that this table was designed for the purpose of obtaining a single value for level of highest educational attainment and is not intended to convey any other ordinality.
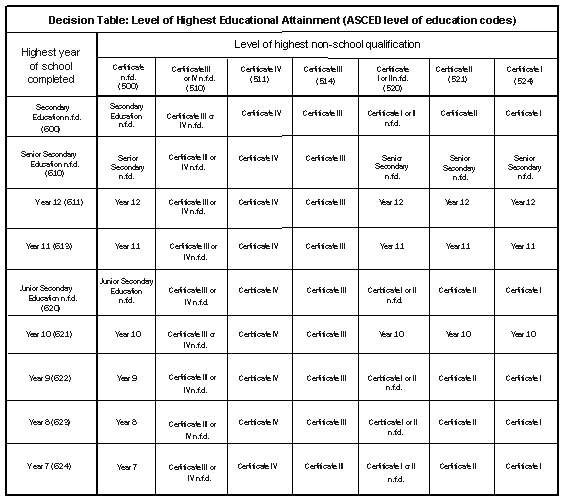
The decision table is also used to rank the information provided in a survey about the qualifications and attainments of a single individual. It does not represent any basis for comparison between differing qualifications. For example, a person whose highest year of school completed was Year 12, and whose level of highest non–school qualification was a Certificate III, would have those responses crosschecked on the decision table and would as a result have their level of highest educational attainment output as Certificate III. However, if the same person answered 'certificate' to the highest non–school qualification question, without any further detail, it would be crosschecked against Year 12 on the decision table as Certificate not further defined. The output would then be Year 12. The decision table, therefore, does not necessarily imply that one qualification is 'higher' than the other. For more details, see
Education Variables, 2002 (cat. no. 1246.0).
PRODUCTS AND SERVICES
Spreadsheets
44 All tables, in Excel spreadsheet format, can be accessed from Downloads. The spreadsheets present tables of estimates and proportions, and their corresponding relative standard errors (RSEs).
Microdata record file
45 In addition to the data available in the Excel spreadsheets, other tables will be able to be produced using Survey TableBuilder (STB). STB is an online tool for creating tables and graphs from survey data. STB for the 2010–11 Learning and Work topic is expected to be available in mid 2012. General information about this new product, including cost, can be found on the About Survey TableBuilder page.
46 A Confidentialised Unit Record File for the 2010–11 Learning and Work topic will not be available.
Data available on request
47 A further option for accessing data from the Learning and Work component of the MPHS is to contact the National Information and Referral Service. A range of additional data not provided in the standard spreadsheets may be provided on a fee–for–service basis. A spreadsheet containing a complete list of the data items available for the Learning and Work topic can be accessed from Downloads.
ACKNOWLEDGEMENTS
48 ABS surveys draw extensively on information provided freely by individuals, businesses, governments and other organisations. Their continued cooperation is very much appreciated. Without it the wide range of statistics published by the ABS would not be available. Information received by the ABS is treated in strict confidence as required by the Census and Statistics Act 1905.
RELATED PUBLICATIONS
49 A wide range of information about Education and Training statistics can be found on the ABS Education and Training Topics @ a Glance web page. This page includes information on current and upcoming projects, links to recent education and training publications and resources, and information about current issues in the education and training sector.
50 The Related Information tab associated with this release contains links to a selected range of ABS Education and Training publications.
 Quality Declaration
  Print Page
 Print All