CAPITAL CITY MAPS - TOTAL FERTILITY RATES
The following maps of Australian capital cities by Statistical Area Level 2 (SA2) illustrate areas of higher and lower fertility.
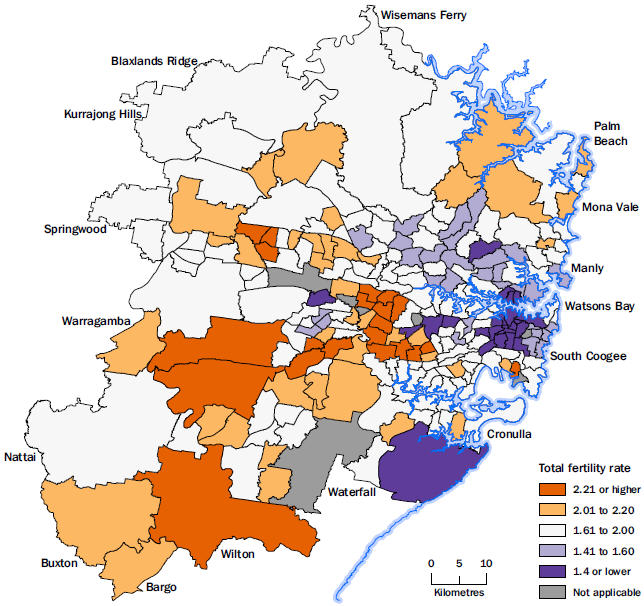
Sydney's lower fertility areas are clustered around the CBD, and extend to the eastern suburbs and inner north. Higher rates are seen in the outer west and south-west. The temporary processing delays described in Explanatory Note 31 of this publication does not impact on the observed pattern in the Greater Sydney area.
Total fertility rate
Greater Sydney, by Statistical Area Level 2, 2014
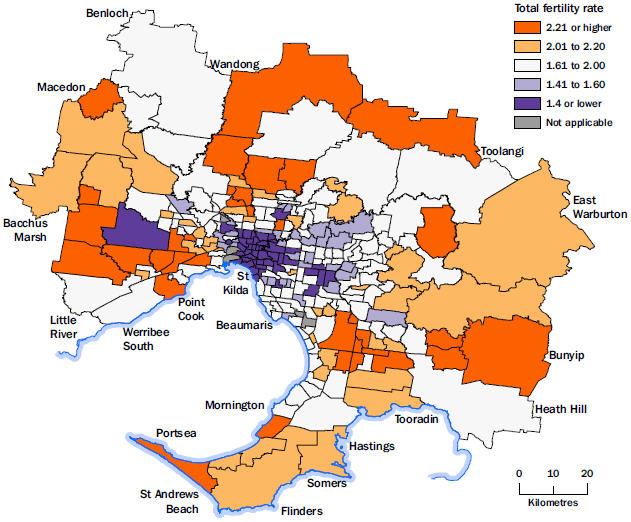
Melbourne's lower fertility rates are concentrated in the inner suburbs and middle suburbia to the east and south-east. The higher fertility rates are seen in the outer west, north and south-east.
Total fertility rate
Greater Melbourne, by Statistical Area Level 2, 2014
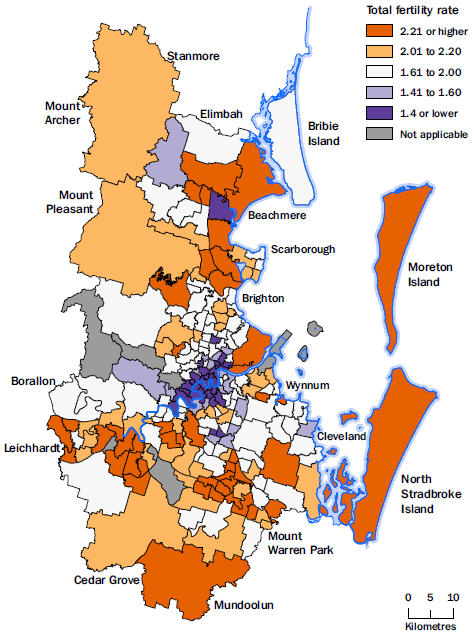
Brisbane's lower fertility areas are in central Brisbane either side of the river, while the higher fertility areas are in the north, south and islands.
Total fertility rate
Brisbane, by Statistical Area Level 2, 2014
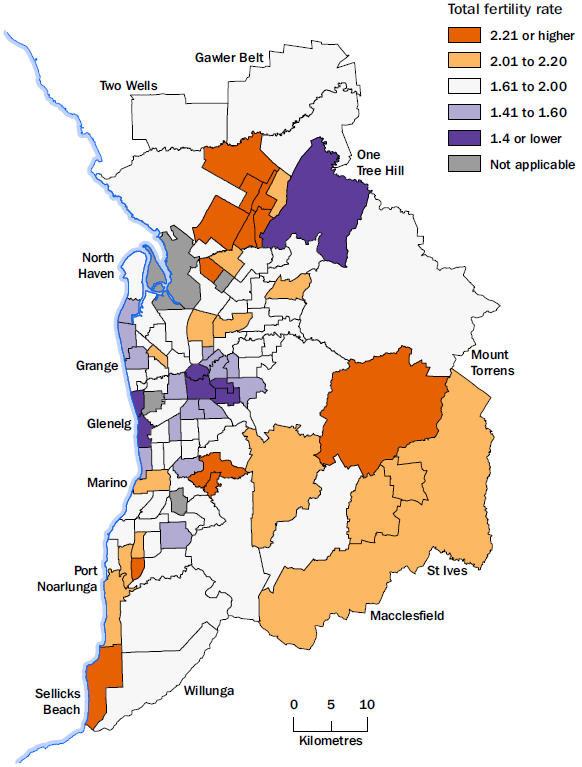
Inner Adelaide and the beach-side suburbs from Brighton to Semaphore have lower fertility rates, while higher rates are in the outer northern and eastern areas.
Total fertility rate
Greater Adelaide, by Statistical Area Level 2, 2014
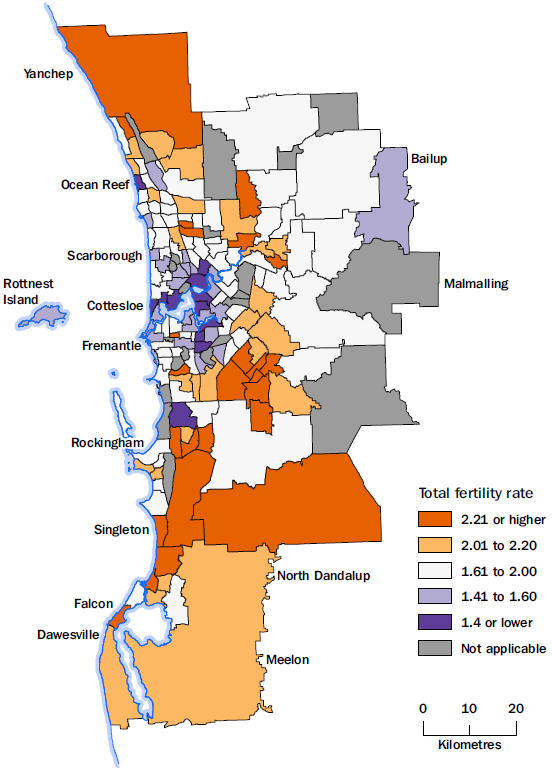
Perth's lower fertility rates are found in the inner area bordered by Scarborough, Fremantle, Canning Vale and Maylands. The outer northern and southern areas have higher fertility rates.
Total fertility rate
Greater Perth, by Statistical Area Level 2, 2014
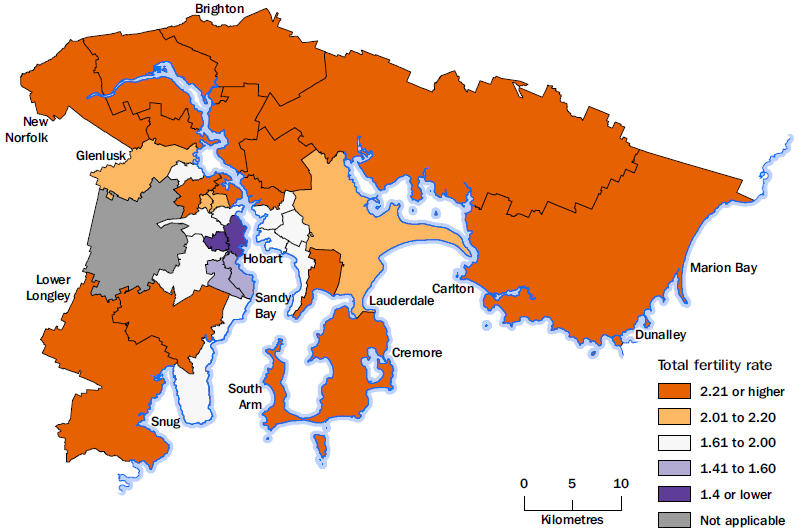
Four inner SA2s, including Hobart and Sandy Bay, have lower fertility rates and the remaining greater Hobart area has higher fertility.
Total fertility rate
Greater Hobart, by Statistical Area Level 2, 2014
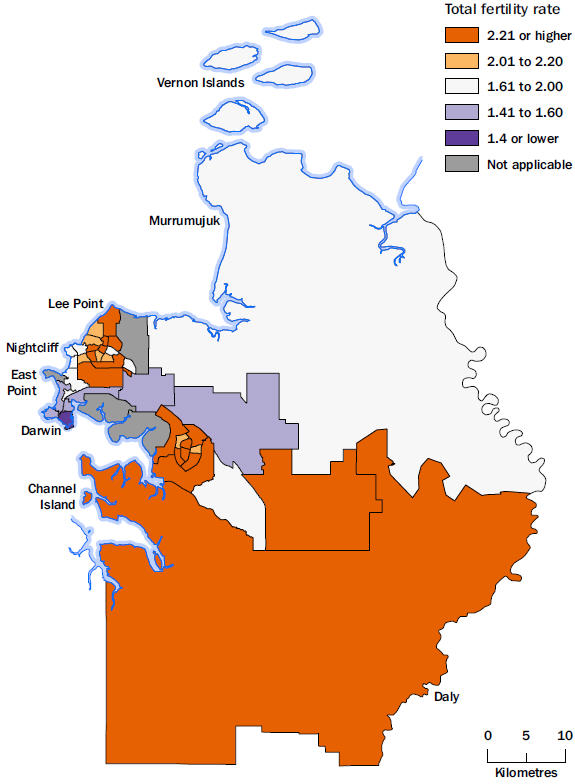
Greater Darwin's lowest fertility rates are in Darwin City, followed by surrounding suburbs and eastwards to Howard Springs. Most of the remaining SA2s have higher fertility rates.
Total fertility rate
Greater Darwin, by Statistical Area Level 2, 2014
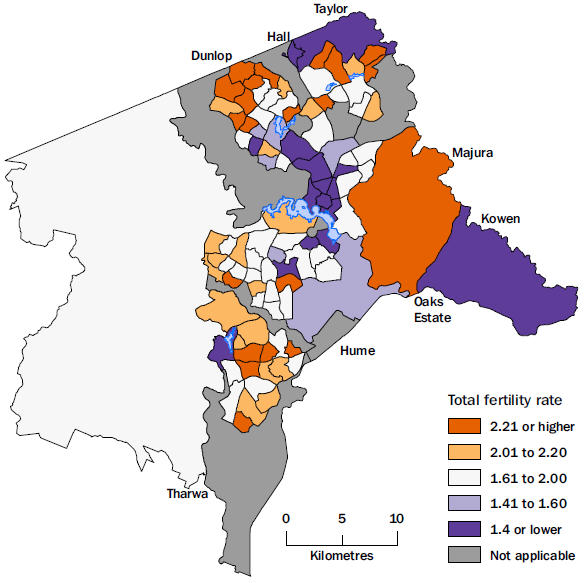
Lower fertility rates are mostly in the inner north of Canberra, while most areas with higher rates are in the outer south and north.
Total fertility rate
Canberra, by Statistical Area Level 2, 2014
 Quality Declaration
  Print Page
 Print All