DEVELOPMENT OF ENVIRONMENTAL TAXES FOR HOUSEHOLDS
In June 2011 there were 16.4 million motor vehicles registered in Australia(footnote 1) . The annual average growth of new vehicles sales for the past five years has been 2.7% (cat. no. 9309.0, 2012). The most common type of fuel used is petrol (82% in 2011, down from 87% in 2006), followed by diesel (up to 15% in 2011 from 11% in 2006). The average age of the fleet of vehicles in Australia was 10.0 years. Campervans, light ridged trucks, heavy rigid trucks and buses recorded decreases in the average age (cat. no. 9309.0, 2012).
Changes to fringe benefits tax for cars from 2012-13 are expected to increase the tax collected by $970 million. This is an estimate from the Treasury on the basis of the reform of the current statutory formula for valuing car fringe benefits. In 2010-11, total FBT revenues to the Commonwealth were just above $3 billion.
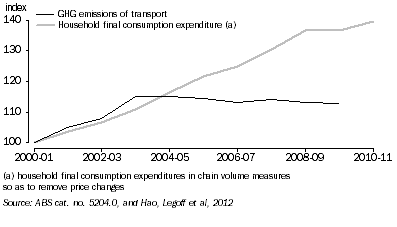
Figure 6.5 presents the relative growth of GHG emissions of transport activities and the final consumption expenditure of households between 2000-01 and 2010-11. It shows that final consumption expenditure over this period while transport emissions have decreased slightly since 2003-04. The environmental taxes that households pay has also grown during this period, and the drivers of the increase are the transport taxes (seen in Appendix 2).
6.5 Growth of household activites, 2000-01 to 2010-11, Index: 2000-01=100

1 All vehicles with the exception of recreational vehicles (e.g. dune buggies), consular and defence force vehicles.
<back
 Print Page
 Print All
 Print Page
 Print All