DETAILED FINDINGS FOR ICT INDUSTRY GROUPINGS
For each ICT industry grouping, this section presents detailed findings about: sources of income; operating expenses; performance measures (by employment size); and selected state and territory indicators.
Refer to Summary Commentary - ICT industry groupings for further explanation about industry groupings.
SOURCES OF INCOME
Source of income classifications differ between industry groupings: these classifications are designed to align with each grouping's main activity. Findings show that, while the majority of income for each industry grouping is attributable to sources associated with its main activity, significant amounts are also sourced from activities secondary to the main activity.
Total income for the Manufacturing grouping was $4,404 million in 2006-07, with the majority attributable to Total income from sales of goods produced (80% or $3,533 million). Sales of ICT goods produced contributed $2,312 million of which: $860 million (37%) was from Radio, television and communication equipment and apparatus; $807 million (35%) from Office, accounting and computing equipment; and $642 million (28%) from Other electronic equipment. Over half the income from Sales of radio, television and communication equipment and apparatus produced resulted from Telephone and telegraph equipment ($454 million).
In 2006-07, the Wholesale trade grouping reported Total income of $50,903 million. The majority of this income came from Sales of goods purchased for resale (88% or $44,997 million) including: Non-ICT electrical and electronic equipment n.e.c. ($15,380 million); and Computer hardware, parts and components ($14,141 million).
The Information media and telecommunications grouping had Total income of $40,208 million during 2006-07. Almost two thirds of this income resulted from the provision of Telecommunication services, for which $26,664 million was reported. Mobile services made the largest contribution ($11,800 million or 44%) to this amount, followed by Basic telephony services ($9,586 million or 36%). Total income from the provision of Internet services ($5,853 million) was dominated by income from Broadband Internet access services, which accounted for 88% ($5,150 million). In contrast, less than 10% resulted from Other Internet access services.
Total income for the Computer system design and related services grouping was $26,049 million in 2006-07. The major source of income was the provision of Computer services ($18,178 million) including: Other consultancy ($4,428 million); Hardware consultancy ($4,062 million); and Customised software consultancy ($4,017 million). In addition, the Computer system design and related services industry grouping earned $5,483 million from Sales of goods (21% of Total income for the grouping).
For 2006-07, the Electronic and precision equipment repair and maintenance grouping reported Total income of $1,275 million. Income from Repair and maintenance of ICT equipment ($514 million) combined with income from the provision of Other ICT services ($61 million) made up 45% of Total income for the grouping. This compared to 27% resulting from Repair and maintenance of non-ICT equipment ($323 million) and provision of Other non-ICT services ($23 million). Sales of ICT goods contributed 25% ($314 million) to Total income for the Electronic and precision equipment repair and maintenance industry grouping.
OPERATING EXPENSES
In general, the composition of operating expenses align with those typically associated with the main activity of each industry grouping. Operating expenses for the Manufacturing grouping in 2006-07 totalled $4,049 million. The major expense items for these businesses were: Purchases of materials, components, containers, packaging materials, electricity, fuels and water ($1,844 million or 46% of Total operating expenses); and Labour costs ($1,069 million or 26%).
In 2006-07, the Wholesale trade grouping had Total operating expenses of $48,445 million. Over half of this expense was due to Purchases of finished information and communications hardware for resale ($25,812 million). Labour costs accounted for 12% ($5,688 million) of Total operating expenses for the grouping.
Total operating expenses for the Information media and telecommunications grouping were $35,417 million in 2006-07. The largest expenses for this grouping were attributable to: Other operating expenses ($9,647 million); Telecommunication services ($6,907 million); Labour costs ($6,240 million); and Depreciation and amortisation ($6,006 million).
The Computer system design and related services grouping reported Total operating expenses of $24,208 million for 2006-07. Total labour costs was by far the largest expense item for these businesses and accounted for 46% ($11,186 million) of Total operating expenses. Other notable expense items for this grouping in 2006-07 are Other operating expenses ($4,548 million) and Purchase of finished goods for resale ($4,128 million).
Largest expense items contributing to Total operating expenses for the Electronic and precision equipment repair and maintenance grouping ($1,154 million) were: Other operating expenses ($350 million or 30%); Labour costs ($332 million or 29%) and Purchases of finished information and communications hardware for resale ($273 million or 24%).
PERFORMANCE MEASURES
The overall Operating profit margin for Australia's ICT industry was 8% in 2006-07. At the industry grouping level, profit margins ranged from a high of 12% for Information media and telecommunications to a low of 6% for Wholesale trade.
Operating profit margin, by ICT industry grouping
: 2006-07

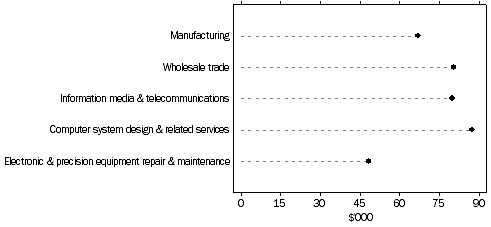
In 2006-07 the average Labour costs per employee for the ICT industry was $81,800. The average varied across industry groupings, with the highest being for Computer system design and related services ($87,300) and the lowest for Electronic and precision equipment repair and maintenance ($48,200).
Labour costs per employee, by ICT industry grouping
: 2006-07
Labour costs comprised 22% of Operating expenses in 2006-07. The proportion was highest for the Computer system design and related services grouping (46%) and lowest for the Wholesale trade grouping (12%).
See also
Summary Commentary for commentary relating to Operating profit before tax and Industry value added.
BUSINESS SIZE
In 2006-07, businesses with 100 or more employees accounted for 52% of employment (155,000 persons) and 68% of total income ($83,990 million). In contrast, businesses with 0-19 employees accounted for 30% of employment but only 15% of total income.
OPBT for businesses with 100 or more employees totalled $7,668 million in 2006-07. This was more than five times the next highest OPBT value, which was $1,427 million for businesses with 0-19 employees.
STATE AND TERRITORY
New South Wales accounted for 40% of Employment (120,000 persons) at 30 June 2007 and, during 2006-07, 43% of both Wages and salaries ($9,013 million) and Sales of goods and services ($51,848 million). Victoria made the next largest contribution to each of these with 28% of Employment (84,000 persons) and 29% of both Wages and salaries ($6,093 million) and Sales of goods or services ($34,748 million).
 Quality Declaration
  Print Page
 Print All