Business averages
These are derived by dividing the estimate of the financial variable in question by the number of operating businesses for that year.
Business comparisons
Compares the profit margin, return on assets and return on net worth for each industry across quartiles. The quartiles divide the units at the 75, 50 and 25 percentile point. For example, table 10 shows that in the Retail industry, those businesses in the highest quartile (75% mark or higher) had a profit margin of 11.8% or more in 2000-01. While those in the lowest quartile (25% mark or lower) had a profit margin of less than 0.3%. The median value was a profit margin of 4.4%.
For conceptual reasons, the calculation of the quartiles do not include units which reported zero profit, zero assets or zero net worth. For example where net worth equals zero, it was not possible to calculate Return on net worth.
Business profitability
Business profitability refers to the proportion of businesses that made a profit, loss or broke even. Broke even is defined as those businesses incurring a profit or loss of less than $500.
Economic Activity Survey (EAS)
An annual business survey which is the main source of the statistics presented in this publication.
Employment
Includes working proprietors, working partners, permanent, part-time, temporary and casual employees, and managerial and executive employees working for a business during the last pay period in June each year. Employees absent on paid or prepaid leave are included.
Gross fixed capital formation (GFCF)
Gross fixed capital formation is measured by the total value of a producers acquisitions, less disposals of fixed assets during the accounting period, plus certain additions to the value of non-produced assets realised by the productive activity of institutional units. Fixed assets are tangible or intangible assets produced as outputs from processes of production that are themselves used repeatedly or continuously in other processes of production for more than one year.
Road vehicles
plus Other transport equipment
plus Industrial machinery and equipment
plus Computer software capitalised
plus Computers and computer peripherals
plus Electronic and electrical machinery and communications equipment
plus Other plant and equipment
plus Dwellings, buildings and other structures
plus Computer software expensed
plus Mining exploration expenditure expensed
plus Mining exploration expenditure written-off
less Disposal of plant, machinery and equipment
less Disposal of dwellings and other structures.
equals GFCF
Industry value added (IVA)
Represents the value added by an industry to the intermediate inputs used by that industry. From 1997-98, IVA has replaced IGP as the official measure of the contribution by industries to GDP. While IVA and IGP both represent gross output less intermediate inputs (or alternatively, the value added to intermediate inputs), introduction of new international standards for measuring economic variables has meant changes to the way in which gross output and intermediate inputs are defined, as follows.
Trading profit
plus Operational funding from Government
plus Own account capital work
equals Capitalised wages and salaries
plus Capitalised purchases
less Capitalised purchases
equals Industry Gross Product (IGP)
plus Computer software (non capitalised) expense
plus Indirect taxes (fringe benefits tax, payroll tax, land rates and taxes)
plus Exploration expenditure written off
less Intellectual property royalty expense
equals IVA.
Interest coverage
The number of times over that businesses can meet their interest expenses from their earnings before interest and taxation, i.e
Investment rate
The proportion of industry value added used to acquire capital, i.e 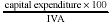
Large businesses
See under 'Classification by size' in paragraph 13 of the Explanatory Notes.
Other businesses
See under 'Classification by size' in paragraph 13 of the Explanatory Notes.
Net worth
Total assets minus total liabilities. This is equal to the interests of shareholders or other owners in the assets of the business.
Management unit
See under 'Statistical unit' in paragraph 6 of the Explanatory Notes.
Operating business
A management unit which is still in existence at the end of the financial reporting period. See 'Management unit' above.
Operating profit before tax (OPBT)
A measure of profit (or loss) before extraordinary items are brought to account and prior to the deduction of income tax and apportions to owners
It is derived as:
Total income
plus Closing inventories
less Total expenses
less Opening inventories
equals OPBT
Profit margin
The percentage of operating income available as operating profit i.e. 
Return on assets
Operating profit before tax as a percentage of the total book value of assets, i.e. 
Return on net worth
Operating profit before tax as a percentage of shareholders' funds, i.e. 
Total operating expenses
The total expenses of a business, excluding extraordinary items.
Total operating income
The total income of a business, excluding extraordinary items
 Print Page
 Print All