OWNERSHIP OF DWELLINGS
Definition and scope
Ownership of dwellings consists of landlords and owner-occupiers of dwellings. Owner-occupiers are regarded as operating a business that generates a gross operating surplus. The imputation of a rent to owner-occupied dwellings enables the services provided by dwellings to their owner-occupiers to be treated consistently with the marketed services provided by rented dwellings to their tenants. Owner-occupiers are regarded as receiving rents (from themselves as consumers), paying expenses, and making a net contribution to the value of production which accrues to them as owners.
Summary of GSP(P) sources and methods
The methodology for Ownership of dwellings uses an output indicator approach to compile state by industry GVA estimates. Output volumes are derived using the HFCE volumes of rent. The state volume GVAs are benchmarked to the annual national industry volume GVA.
Results for Ownership of dwellings
Ownership of dwellings gross value added(a), Chain volume measures(b) |
|  |
| 2000-01 | 2001-02 | 2002-03 | 2003-04 | 2004-05 | 2005-06 | |
Values ($m) | |
| |
| New South Wales | 22 766 | 23 627 | 24 539 | 25 459 | 26 531 | 27 535 | |
| Victoria | 14 559 | 15 117 | 15 716 | 16 324 | 17 028 | 17 686 | |
| Queensland | 10 557 | 10 993 | 11 466 | 11 945 | 12 484 | 12 991 | |
| South Australia | 4 163 | 4 316 | 4 480 | 4 646 | 4 839 | 5 018 | |
| Western Australia | 5 436 | 5 646 | 5 873 | 6 106 | 6 376 | 6 635 | |
| Tasmania | 965 | 1 000 | 1 039 | 1 079 | 1 124 | 1 167 | |
| Northern Territory | 810 | 840 | 871 | 903 | 943 | 980 | |
| Australian Capital Territory | 1 377 | 1 429 | 1 483 | 1 537 | 1 600 | 1 661 | |
| Australia | 60 647 | 62 978 | 65 473 | 68 002 | 70 927 | 73 673 | |
Percentage changes from previous year (%) | |
| |
| New South Wales | 3.8 | 3.8 | 3.9 | 3.7 | 4.2 | 3.8 | |
| Victoria | 3.8 | 3.8 | 4.0 | 3.9 | 4.3 | 3.9 | |
| Queensland | 4.0 | 4.1 | 4.3 | 4.2 | 4.5 | 4.1 | |
| South Australia | 3.6 | 3.7 | 3.8 | 3.7 | 4.2 | 3.7 | |
| Western Australia | 3.8 | 3.9 | 4.0 | 4.0 | 4.4 | 4.1 | |
| Tasmania | 3.5 | 3.6 | 3.9 | 3.9 | 4.2 | 3.8 | |
| Northern Territory | 3.8 | 3.7 | 3.7 | 3.8 | 4.4 | 4.0 | |
| Australian Capital Territory | 3.8 | 3.7 | 3.8 | 3.7 | 4.1 | 3.8 | |
| Australia | 3.8 | 3.8 | 4.0 | 3.9 | 4.3 | 3.9 | |
| |
| (a) At basic prices. |
| (b) Reference year for chain volume measures is 2004-05. |
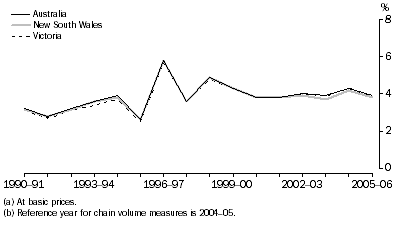
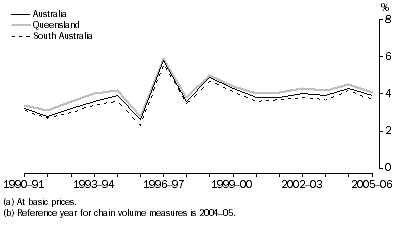
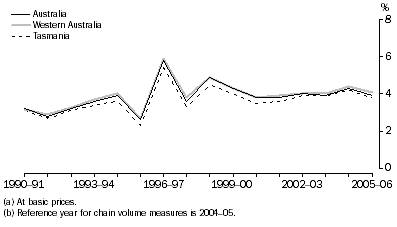
Ownership of dwellings gross value added(a), Chain volume measures(b)-Percentage changes
Ownership of dwellings gross value added(a), Chain volume measures(b)-Percentage changes
Ownership of dwellings gross value added(a), Chain volume measures(b)-Percentage changes
Ownership of dwellings gross value added(a), Chain volume measures(b)-Percentage changes
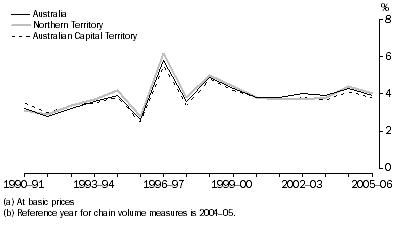
All states exhibited a positive growth pattern similar to Australia throughout the time series. The rise in growth in 1996-97 is related to the fall in interest rates from around 10% in 1995-96 to around 7% in 1996-97. Since 2000-01, all states have exhibited growth rates around 4%.
Ownership of dwellings gross value added, State shares - Current prices |
| |
| 1989-90 | 1994-95 | 1999-00 | 2003-04 | 2004-05 | 2005-06 | |
| % | % | % | % | % | % | |
| |
| New South Wales | 41.6 | 39.9 | 40.1 | 38.6 | 37.4 | 36.4 | |
| Victoria | 25.4 | 23.4 | 24.2 | 24.0 | 24.0 | 23.6 | |
| Queensland | 14.0 | 16.6 | 16.2 | 16.8 | 17.6 | 18.4 | |
| South Australia | 7.0 | 7.3 | 6.8 | 6.7 | 6.8 | 6.8 | |
| Western Australia | 7.8 | 7.9 | 8.2 | 8.9 | 9.0 | 9.3 | |
| Tasmania | 1.7 | 1.9 | 1.7 | 1.6 | 1.6 | 1.6 | |
| Northern Territory | 0.6 | 0.8 | 1.0 | 1.1 | 1.3 | 1.6 | |
| Australian Capital Territory | 1.9 | 2.2 | 1.8 | 2.2 | 2.3 | 2.2 | |
| Australia | 100.0 | 100.0 | 100.0 | 100.0 | 100.0 | 100.0 | |
| |
New South Wales, Queensland and Victoria accounted for almost 80% of Australian Ownership of dwellings GVA in 2005-06. State shares have fallen in New South Wales and Victoria throughout the time series, with New South Wales falling from 41.6% in 1989-90 to 36.4% in 2005-06. Queensland, Western Australia and the Northern Territory have been the states whose shares have risen, with Queensland rising from 14.0% in 1989-90 to 18.4% in 2005-06. The shares for South Australia, Tasmania and the Australian Capital Territory have remained fairly stable.
 Print Page
 Print All