3250.0 - Information Paper: Ensuring the Quality of Rebased Population Estimates, June 2011
ARCHIVED ISSUE Released at 11:30 AM (CANBERRA TIME) 05/07/2012 First Issue
Page tools:
 Print Page Print Page
 Print All Print All
| ||||||||||||||||||||||||||||||||||||||||||||||||||||||||||||||||||||||||||||||||||||||||||||||||||||||||||||||||||||||||||||||||||||||||||||||||||||||||||||||||||||||||||||||||||||||||||||||||||||||||||||||||||||||||||||||||||
|
PRELIMINARY ERP BY STATE AND TERRITORY – DEMOGRAPHIC ADJUSTMENT WHAT IS THE DEMOGRAPHIC ADJUSTMENT? Demographic adjustment is, in essence, a data coherence exercise. A number of checks are made against other sources of population data to fix known and anticipated problems in the new population base, such as the effects of misreporting age on the Census form and correlation bias between Census counts and estimates of undercount. Correlation bias is where persons who are missed in the Census tend to be also missed in the Post Enumeration Survey. The data coherence checks are usually made at the five year age group cohort level, but in the very young or very high ages, single year of age is also checked. Included in these checks are:
Demographic adjustment can be considered in two main categories:
COHORT ANALYSIS ADJUSTMENT The purpose of the cohort analysis adjustment is to correct any demographically implausible features in the data that may have been introduced by the sample survey nature of the Post Enumeration Survey (PES). Data Coherence Sources
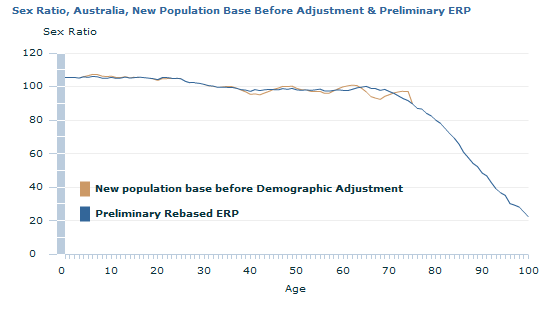
Age Group: 5–9 years For the 5–9 year age group, the sex ratio of the new 2011 population base was too high compared with data coherence sources. An adjustment was introduced to reduce the level of males by 7,820, reducing the sex ratio from 106.6 down to 105.5. A high sex ratio of 106.6 for this age group was considered demographically implausible and would have to be attributed to a specific occurrence. The ABS Demographic Databank value of 105.5 was considered more accurate as it is based on recent birth and death records and is therefore considered the most up-to-date data source for this age group. The level of males was higher than the data coherence sources while female levels were closer to supporting data. It was therefore considered appropriate to only adjust males in this age group. The adjustment of 7,820 was 1.3 times the 2011 Census undercount standard error of 5,910 for this age group by sex. For the 10–14 year age group, the sex ratio of the new 2011 population base was too high compared with data coherence sources. An adjustment was introduced to reduce the level of males by 3,040, reducing the sex ratio from 105.7 down to 105.2. Like the 5–9 year age group, the level of males was higher than data coherence sources while female levels were closer to supporting data. It was therefore considered appropriate to only adjust males in this age group. The adjustment of 3,040 was 0.6 times the 2011 Census undercount standard error of 5,120 for this age group by sex. For the 40–44 year age group, the sex ratio of the new 2011 population base was too low compared with data coherence sources. An adjustment was introduced to raise the male level by 6,160 and reduce female level by 11,160, for a net adjustment of –5,000. This raised the sex ratio from 95.8 up to 97.9. The ratio achieved was slightly lower than comparative data sources for two reasons: (1) any greater ratio adjustment would have required a level adjustment that was too far outside Census undercount standard errors, and (2) in all data coherence sources, the sex ratio for this age group was lower than the age group on either side and a ratio of 97.9 allowed this feature to be maintained in the preliminary ERP. The female level differed from data coherence sources more than the male level and this was reflected in the adjustments made. The increase of 6,160 for males was 1.0 times the 2011 Census undercount standard error of 6,310 for this age group by sex, while the decrease of 11,160 for females was 1.8 times the 2011 Census undercount standard error of 6,080 for this age group by sex. Age Group: 45–49 years For the 45–49 year age group, the sex ratio of the new 2011 population base was too high compared with data coherence sources. An adjustment was introduced to raise the level of females by 8,520, reducing the sex ratio from 99.6 down to 98.5. The female level was below coherence data sources while the male level compared well with the sources so it was considered appropriate to adjust females only in this age group. The adjustment of 8,520 was 1.6 times the 2011 Census undercount standard error of 5,450 for this age group by sex. For the 55–59 year age group, the sex ratio of the new 2011 population base was too low compared with data coherence sources. An adjustment was introduced to raise the level of males by 5,710, increasing the sex ratio from 97.0 up to 97.8. For higher age groups, the Census undercount estimation method is less optimised for sex ratio figures. This results in an adjustment that tends towards a census-based sex ratio that become more accurate for higher age groups. Data coherence sources suggested that the level decline for males aged 55–59 years in 2011 compared to this cohort in the 2006 Census should not be as large as the new 2011 population base indicated. The level of females matched the data coherence sources more closely, so it was considered appropriate to adjust males only in this age group. The increase of 5,710 was 1.0 times the 2011 Census undercount standard error of 5,500 for this age group by sex. For the 60–64 year age group, the sex ratio of the new 2011 population base was too high compared with data coherence sources. An adjustment was introduced to raise the level of females by 10,950, reducing the sex ratio from 100.2 down to 98.5. For higher age groups, the Census undercount estimation method is less optimised for sex ratio figures. This results in an adjustment that tends towards a census-based sex ratio that become more accurate for higher age groups. In the data coherence sources, the peak sex ratio for older age groups occurs in the 65–69 years age group. This required the sex ratio for the 60–64 years age group in 2011 to be lower than some of the data coherence sources, but closer to the sex ratio based on unrebased ERP as at 30 June 2011. The female level was comparatively low, whereas the male level which was comparable with data coherence sources. The female overcount rate was also comparatively high, so it was considered appropriate to adjust females only in this age group. The increase of 10,950 was 2.3 times the 2011 Census undercount standard error of 4,870 for this age group by sex. This is a relatively large adjustment indicating possible non-sampling error which also required adjustment. For the 65–69 year age group, the sex ratio of the new 2011 population base was too low compared with data coherence sources. An adjustment was introduced to raise the level of males by 11,530 and reduce the level of females by 11,530, for a net age group adjustment of zero. This raised the sex ratio from 94.2 up to 98.9. For higher age groups, the Census undercount estimation method is less optimised for sex ratio figures. This results in an adjustment that tends towards a census-based sex ratio that become more accurate for higher age groups. In the data coherence sources, the peak sex ratio for older age groups occurs in this age group. The ratio of 98.9 maintains this feature and agrees with the sex ratios of the data coherence sources. The level of females was least comparable with the data coherence sources. However, correcting the female level alone produced an adjustment too far outside the sampling variance in the 2011 Post Enumeration Survey. A decrease of 11,530 for females is 2.5 times the 2011 Census undercount standard error of 4,660 for this age group by sex, while the increase of 11,530 males is 2.8 times 2011 Census undercount standard error of 4,200 for this age group by sex. This is a relatively large adjustment, indicating possible non-sampling error which required adjustment. For the 70–74 year age group, the sex ratio of the new 2011 population base was too high compared with data coherence sources. An adjustment was introduced to reduce the level of males by 7,460, reducing the sex ratio from 96.6 down to 94.5. For higher age groups, the Census undercount estimation method is less optimised for sex ratio figures. This results in an adjustment that tends towards a census-based sex ratio that become more accurate for higher age groups. The male level was less comparable to data coherence sources and it was considered appropriate to adjust males only in this age group. A decrease of 7,460 for males was 2.0 times the 2011 Census undercount standard error of 3,790 for this age group by sex. Table 1 summarises the demographic adjustments made during the cohort analysis process. Table 1: Demographic adjustments, by sex and age, as a result of the 2011 cohort analysis
*Values in this table have been rounded to the nearest 10 persons.
The net cohort analysis adjustment for males is an increase of 5,070 persons and the net adjustment for females is a decrease of 3,200 persons. The net cohort analysis adjustment is notably smaller in magnitude than the adjustment of –15,200 from the previous rebasing process in 2006. It is lower because there are more instances in 2011 of 'splitting the difference' and adjusting both males and females to achieve a sex ratio that is coherent with other sources. The gross adjustment, summing the absolute value of the adjustment for each age group by sex, is 83,900 persons. The gross adjustment is larger than the 2006 rebasing process total of 47,300 due to increased volatility in the sex ratios, particularly in upper ages. During the 2011 rebasing process, age groups were only adjusted for sex ratio coherence and not solely for level coherence. There are three main reasons for this:
State Distribution of the 2011 Cohort Analysis Adjustment The 2011 cohort analysis adjustment was distributed between states and territories based on distribution of males and females for each age group. Table 2 shows the state and territory distribution of the net 2011 cohort analysis adjustment for preliminary ERP. Table 2: The distribution of 2011 net cohort analysis adjustment between the states and territories
*Numbers have been rounded to the nearest 10 persons. CENSUS UPPER AGE MISREPORTING AND VANDALS Persons who appear likely to be deliberately misreporting information such as age on the Census form are colloquially referred to as census age vandals. Census age vandals are a particular group that need to be adjusted for in the rebasing process. Analysis has shown that some respondents to the Census tend to report a very high age. Like the 2006 Census, the 2011 Census allowed respondents to either enter their date of birth or their age. This broadens the scope for either respondent or coding error. The upper age structure is particularly distorted by age misreporting due to the small population numbers in these very high ages. Even a small number of misreported ages can have a large impact on sex ratios, death rates and life expectancy calculations. Each Census form with a reported age of over 85 was given a 'likelihood of misreporting' value. This value was automatically derived from probabilities given to extreme responses such as highest income bracket, high number of bedrooms, high number of cars, or an unlikely combination of birthplace, language spoken at home and religion. A sample of forms with high likelihoods was selected from each state and territory for closer assessment in order to determine cut-off values for the likelihood. Persons recorded on Census forms were then classed as misreported if their 'likelihood of misreporting' value was higher than the determined cut-off. The population distribution by single year for the age group 85 years and over was adjusted through this process. Individuals with extremely improbable combinations of characteristics were removed from the 85 years and over age group. The count of persons removed was then redistributed across the 75 years and over age group across each state and territory so as to retain the total number in the 75 years and over age group. A total of 1,060 persons aged 85 to 99 years were classified as being age misreported or vandals, while 270 persons aged 100 years and over were classified as being age misreported or vandals. The total of 1,060 represents 0.25% of the population aged 85 to 99 years and 270 represents 8.9% of the population aged 100 and over. The age misreporting and vandals adjustment affects the age structure of the population but not the total, so the overall net adjustment from the census upper age misreporting and vandals adjustment was zero. Table 3: State, sex and agegroup breakdown of age misreporting and vandals adjustment
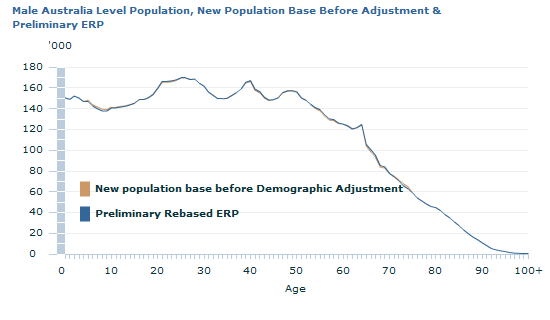
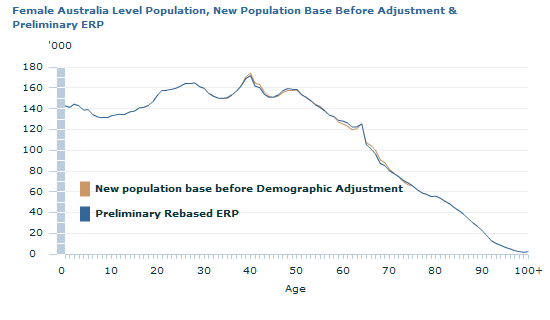
*Numbers have been rounded to the nearest 10 persons. EFFECT OF THE DEMOGRAPHIC ADJUSTMENT IN 2011 Figure 2 and figure 3 show the effect of the 2011 demographic adjustment, both the cohort analysis adjustment and the census upper age misreporting and vandal adjustment, on the new 2011 population base for males and females. The graphs show that the demographic adjustment has had minimal impact on the overall population level in 2011, but had the effect of smoothing out some of the age groups.
 Figure 3: The effect of cohort analysis adjustment on number of females 
 Document Selection These documents will be presented in a new window.
|
|||||||||||||||||||||||||||||||||||||||||||||||||||||||||||||||||||||||||||||||||||||||||||||||||||||||||||||||||||||||||||||||||||||||||||||||||||||||||||||||||||||||||||||||||||||||||||||||||||||||||||||||||||||||||||||||||
