APPENDIX: WEIGHTING THE ACLD
INTRODUCTION
The process of weighting enables the data user to estimate the number of people in the whole population with particular characteristics based on the observations from a sample. To do this, a 'weight' is allocated to each sample unit. The value of the weight indicates how many population units are represented by the sample unit.
The ACLD is designed to measure change in Australian society over time. For the 2011 ACLD Panel, a longitudinal weight has been implemented which allows the weighted sample to represent all persons who were in scope of both of the 2011 and 2016 Censuses. As shown in Figure 1, this ‘longitudinal population’ is the overlap between the two Censuses (the shaded region). To estimate the size of this population, the 2016 Estimated Resident Population (ERP) was multiplied by the estimated probability that a person was in scope in 2011, calculated using the 2016 Census responses for the reported 5 year ago address. Further information on this approach can be found in the paper Chipperfield, Brown & Watson (2017).
FIGURE 1 - IN SCOPE POPULATION FOR THE AUSTRALIAN CENSUS LONGITUDINAL DATASET, 2011-2016
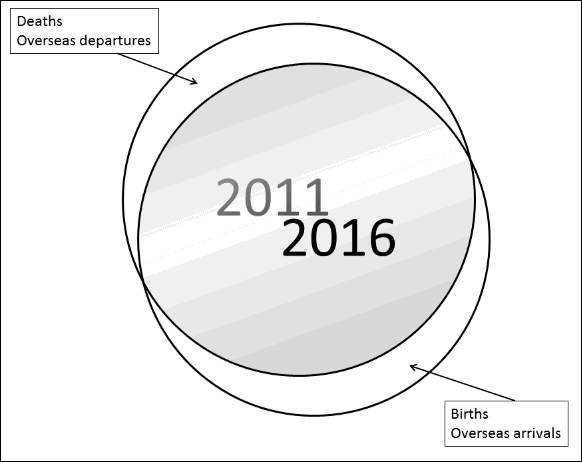
This method for estimating the relevant overlapping 2011 and 2016 populations is an improvement over the method used in the original linkage of the 2006-2011 ACLD. The current approach overcomes the limitations of the previous approach which inaccurately accounted for:
- people who were overseas arrivals after one Census and who subsequently left Australia (or died) before the following Census; and
- people who left Australia after one Census and then returned to Australia before the following Census.
CALCULATING LONGITUDINAL WEIGHTS
Longitudinal weights were calculated for each 2011 Panel sample record that was linked to a 2016 Census record. No weights were calculated for the unlinked records. The longitudinal weight for a linked sample record in this release of the ACLD is a measure of how many people it represents in the 2011 and 2016 overlapping populations. The weights consist of three components. The first component reflects the probability of a record being selected in the 2011 Panel sample. The second component takes into account that some selected records are less likely to be linked than other selected records. The third component takes into account Census undercount (e.g. a person in an undercounted population is less likely to have a Census record and so is less likely to have a selected Census record) and ensures that the weights are consistent with population benchmarks. These three components lead to the final weight, calculated as:
Final weight = (Design weight) x (Missed link adjustment) x (Calibration to known population totals adjustment).
Design Weight
The records in the 2011 ACLD Panel sample were selected from the 2011 Census population using equal probability random selection. For a sample size of 5.7%, the design weight for all records of the ACLD is the inverse of the probability of selection, and is equal to 17.5.
Missed Link Adjustment
A missed link occurs when a 2011 sampled record has a corresponding 2016 Census record, but the link is not identified. As missed links are more likely to occur in certain population groups, not making this adjustment would mean that these population groups would be under-represented in the linked sample. The missed link adjustment weight is equal to the inverse of the estimated propensity to link. No attempt was made to correct for false links.
The propensity to link was estimated using a logistic regression model that was applied to the 2011 Panel sample with link status as the response variable. The logistic regression model describes a relationship between a 2011 sample record's propensity to link and its values for a range of 2011 Census variables such as Indigenous status, marital status, country of birth, language spoken at home and English proficiency, labour force participation and occupation, educational attainment, mobility (whether moved address in the preceding year) and remoteness. It was found that the estimated propensity to link varied considerably between records.
Two separate models were applied to the 2011 Panel sample. The first model was applied to people under the age of 15 years on 2011 Census night. This model excluded the variables that were not applicable to people under 15 years of age, such as marital status and labour force participation. The second model was applied to the remainder of the sample (persons aged 15 years or over in 2011).
The missed link adjustment carries the assumption that the ACLD contains no false links, while not assuming that all records in the 2011 sample have a corresponding 2016 Census record.
Odds ratios and accompanying Wald confidence intervals for the predictor variables for the first model (for persons aged under 15 years in 2011) are contained in Table A.1. A comparison group is selected for each characteristic, and the odds ratio for the other categories represents the ratio of the odds of being linked in contrast to the comparison group. For instance, Table A.1 shows the odds ratios by age group in 2011. Those persons aged under 15 years with English proficiency ‘Not at All’ were less likely to be linked than those with English proficiency ‘Very Well’ (the comparison group), but more likely than those with English proficiency ‘Not Well’. Conversely, the odds ratios for remoteness in 2011 show that persons aged under 15 years reporting 'Inner Regional' were more likely to be linked than those reporting 'Major City' (the comparison group).
TABLE A.1 - ODDS RATIOS FROM THE LOGISTIC REGRESSION MODEL, Persons aged under 15 years, 2011
 | | | 95% CONFIDENCE LIMITS |
| Selected characteristics | Odds ratio | Low limit | Upper limit |
| | | |
|
AGE GROUP
|
| 0-7 years (comparison group) | 1.000 | . . | . . |
| 8-13 years | 1.013 | 1.000 | 1.026 |
| 14 years | 1.011 | 0.989 | 1.033 |
|
COUNTRY OF BIRTH
|
| Oceania and Antarctica (non-Indigenous persons) (comparison group) | 1.000 | . . | . . |
| Americas | 0.577 | 0.525 | 0.635 |
| Indigenous Australian | 0.872 | 0.847 | 0.897 |
| North Africa & Middle East | 0.465 | 0.423 | 0.510 |
| North-East Asia | 0.526 | 0.483 | 0.572 |
| North-West Europe | 0.661 | 0.630 | 0.693 |
| South-East Asia | 0.569 | 0.533 | 0.606 |
| Southern & Central Asia | 0.620 | 0.582 | 0.660 |
| Southern & Eastern Europe | 0.425 | 0.360 | 0.501 |
| Sub Saharan Africa | 0.722 | 0.668 | 0.780 |
| Missing(a) | 0.773 | 0.710 | 0.841 |
|
LANGUAGE
|
| English (comparison group) | 1.000 | . . | . . |
| Australian Indigenous | 1.087 | 0.976 | 1.211 |
| East Asian | 0.992 | 0.954 | 1.032 |
| East European | 0.973 | 0.916 | 1.034 |
| Other North European | 0.967 | 0.891 | 1.050 |
| South Asian | 1.004 | 0.955 | 1.056 |
| South East Asian | 0.987 | 0.943 | 1.033 |
| South European | 0.977 | 0.934 | 1.021 |
| South West and Central Asian | 0.984 | 0.940 | 1.029 |
| Other | 0.805 | 0.754 | 0.859 |
| Missing(a) | 0.882 | 0.803 | 0.969 |
|
ENGLISH PROFICIENCY
|
| Very Well (comparison group) | 1.000 | . . | . . |
| Well | 0.777 | 0.743 | 0.812 |
| Not Well | 0.644 | 0.589 | 0.704 |
| Not at All | 0.806 | 0.658 | 0.987 |
| Missing | 0.939 | 0.841 | 1.049 |
|
MOBILITY
|
| Same usual address one year ago (comparison group) | 1.000 | . . | . . |
| Different usual address one year ago | 0.838 | 0.829 | 0.848 |
|
SCHOOL SECTOR
|
| Government (comparison group) | 1.000 | . . | . . |
| Catholic | 1.042 | 1.026 | 1.058 |
| Other Non-Government | 1.057 | 1.039 | 1.076 |
| Missing/Other(b) | 0.874 | 0.853 | 0.896 |
|
REMOTENESS
|
| Major City (comparison group) | 1.000 | . . | . . |
| Inner Regional | 1.021 | 1.006 | 1.036 |
| Outer Regional | 1.010 | 0.989 | 1.031 |
| Remote | 0.961 | 0.913 | 1.012 |
| Very Remote | 0.936 | 0.866 | 1.011 |
| Other(c) | 1.047 | 0.813 | 1.348 |
|
. . Not applicable
(a) Includes Supplementary codes
(b) Includes other school sector and pre-school
(c) Includes Migratory, Offshore and Shipping Zones and No usual address
Source: Australian Census Longitudinal Dataset
Odds ratios and accompanying Wald confidence intervals for the predictor variables in the second model (for persons aged 15 years or over in 2011) are contained in Table A.2. A wider variety of variables were available for this age group. In comparison to those persons aged under 15, persons aged 15 years or over with English proficiency ‘Not Well’ were less likely to be linked than those with English proficiency ‘Very Well’ (the comparison group), but more likely than those with English proficiency ‘Not At All’. Conversely, the odds ratios for age in 2011 show that persons reporting aged 65 and over were more likely to be linked than those reporting age 15-24 (the comparison group). This was similar for persons reporting 'Clerical and Administrative' and 'Sales Workers' for Occupation as they were more likely to be linked than those that were 'Not in the labour force' (the comparison group).
TABLE A.2 - ODDS RATIOS FROM LOGISTIC REGRESSION MODEL, persons aged 15 years or over, 2011
| | | | 95% CONFIDENCE LIMITS |
| Selected characteristics | Odds ratio | Low limit | Upper limit |
| | | |
|
AGE GROUP
|
| 15-24 years (comparison group) | 1.000 | . . | . . |
| 25-34 vs 15-24 | 0.841 | 0.832 | 0.850 |
| 35-44 vs 15-24 | 0.968 | 0.957 | 0.978 |
| 45-54 vs 15-24 | 1.008 | 0.997 | 1.020 |
| 55-64 vs 15-24 | 1.031 | 1.019 | 1.043 |
| 65+ vs 15-24 | 1.080 | 1.067 | 1.094 |
|
COUNTRY OF BIRTH
|
| Oceania and Antarctica (non-Indigenous persons) (comparison group) | 1.000 | . . | . . |
| Americas | 0.829 | 0.810 | 0.848 |
| Indigenous Australian | 0.955 | 0.939 | 0.971 |
| North Africa & Middle East | 0.951 | 0.928 | 0.976 |
| North-East Asia | 0.748 | 0.730 | 0.766 |
| North-West Europe | 0.951 | 0.943 | 0.959 |
| South-East Asia | 0.894 | 0.877 | 0.911 |
| Southern & Central Asia | 0.838 | 0.820 | 0.858 |
| Southern & Eastern Europe | 0.976 | 0.961 | 0.992 |
| Sub Saharan Africa | 0.930 | 0.912 | 0.949 |
| Missing | 0.884 | 0.867 | 0.900 |
|
LANGUAGE
|
| English (comparison group) | 1.000 | . . | . . |
| Australian Indigenous | 0.978 | 0.925 | 1.035 |
| East Asian | 1.004 | 0.983 | 1.026 |
| East European | 1.006 | 0.986 | 1.026 |
| Other North European | 0.926 | 0.902 | 0.950 |
| South Asian | 0.947 | 0.922 | 0.973 |
| South East Asian | 0.969 | 0.948 | 0.990 |
| South European | 0.953 | 0.940 | 0.967 |
| South West and Central Asian | 0.989 | 0.965 | 1.013 |
| Missing | 0.951 | 0.918 | 0.985 |
| Other | 0.836 | 0.813 | 0.860 |
|
ENGLISH PROFICIENCY
|
| Very Well (comparison group) | 1.000 | . . | . . |
| Well | 0.859 | 0.848 | 0.871 |
| Not Well | 0.826 | 0.811 | 0.840 |
| Not at All | 0.661 | 0.636 | 0.687 |
| Not stated | 0.950 | 0.912 | 0.990 |
|
MOBILITY
|
| Same usual address one year ago (comparison group) | 1.000 | . . | . . |
| Different usual address one year ago | 0.797 | 0.793 | 0.801 |
| Remoteness | | | |
| Major City (comparison group) | 1.000 | . . | . . |
| Inner Regional | 1.005 | 0.999 | 1.011 |
| Outer Regional | 0.979 | 0.971 | 0.987 |
| Remote | 0.938 | 0.918 | 0.959 |
| Very Remote | 0.845 | 0.818 | 0.874 |
| Other(b) | 0.948 | 0.894 | 1.005 |
|
REGISTERED MARITAL STATUS
|
| Married (comparison group) | 1.000 | . . | . . |
| Separated | 0.951 | 0.938 | 0.964 |
| Divorced | 0.939 | 0.931 | 0.947 |
| Widowed | 0.991 | 0.980 | 1.002 |
| Never Married | 0.940 | 0.933 | 0.946 |
|
HIGHEST YEAR OF SCHOOL COMPLETED
|
| Year 12 (comparison group) | 1.000 | . . | . . |
| Year 11 | 1.010 | 1.002 | 1.018 |
| Year 10 | 0.996 | 0.989 | 1.003 |
| Year 9 or below(a) | 1.003 | 0.995 | 1.012 |
| Not stated | 0.990 | 0.974 | 1.007 |
|
LABOUR FORCE STATUS AND OCCUPATION
|
| Not in the labour force (comparison group) | 1.000 | . . | . . |
| Unemployed | 0.954 | 0.942 | 0.966 |
| Employed | | | |
| Professional | 1.080 | 1.070 | 1.090 |
| Manager | 1.045 | 1.035 | 1.055 |
| Technicians and trades | 1.038 | 1.028 | 1.049 |
| Community and personal service | 1.056 | 1.045 | 1.067 |
| Clerical and administrative | 1.076 | 1.065 | 1.086 |
| Sales workers | 1.075 | 1.063 | 1.086 |
| Machinery operators and drivers | 1.016 | 1.003 | 1.030 |
| Labourers | 0.999 | 0.988 | 1.010 |
| Employed, occupation not stated | 0.865 | 0.843 | 0.887 |
| Not stated | 0.889 | 0.863 | 0.916 |
|
LEVEL OF NON-SCHOOL QUALIFICATION
|
| No post-school qualification (comparison group) | 1.000 | . . | . . |
| Postgraduate Degree | 0.969 | 0.958 | 0.982 |
| Graduate Diploma and Graduate Certificate | 1.028 | 1.012 | 1.045 |
| Bachelor Degree | 0.985 | 0.977 | 0.993 |
| Advanced Diploma and Diploma | 1.009 | 1.001 | 1.018 |
| Certificate | 1.021 | 1.015 | 1.028 |
| Level of non-school qualification not stated or inadequately described | 0.948 | 0.936 | 0.960 |
|
. . Not applicable
(a) Includes persons who did not go to school.
(b) Includes Migratory, Offshore and Shipping Zones and No usual address
Source: Australian Census Longitudinal Dataset, 2011-2016
Calibration to Longitudinal Population Totals
At this point in the process an intermediate weight had been calculated for each linked sample record that was equal to (Design weight) x (Missed link adjustment). This intermediate weight was then calibrated (or adjusted) so that the resulting weighted counts of the ACLD links would be equal to estimates of the longitudinal population size at the national and selected sub-national levels. The two sets of longitudinal population groups calibrated to were:
- state/territory, by sex, by ten year age group;
- Indigenous status by state/territory.
The size of these longitudinal population groups was estimated by multiplying the 2016 ERP for each group by the estimated proportion of 2016 Census responders for that group who reported being in scope of the 2011 Census, i.e. resident at an Australian address on 2011 Census night. These proportions were estimated for the cross-classification of the state/territory, age group, and sex (Table A.3) and separately for the cross-classification of state and Indigenous status (Table A.4) using the responses to the 2016 Census address five years ago question. For example, Table A.3 indicates that 96.7% of males in NSW aged 45-54 reported being in scope of the 2011 Census.
TABLE A.3. ESTIMATED PROPORTION OF 2016 CENSUS RESPONDENTS IN SCOPE OF THE 2011 CENSUS, By state/territory, sex and age
| STATE/TERRITORY 2011 AND 2016 |
| Age group (years) | Males
(no.) | Females
(no.) |
|
NEW SOUTH WALES
|
| 5-14 | 0.949 | 0.949 |
| 15-24 | 0.889 | 0.883 |
| 25-34 | 0.835 | 0.823 |
| 35-44 | 0.918 | 0.925 |
| 45-54 | 0.967 | 0.967 |
| 55-64 | 0.979 | 0.974 |
| 65-74 | 0.984 | 0.983 |
| 75-84 | 0.991 | 0.991 |
| 85 or over | 0.995 | 0.995 |
|
VICTORIA
|
| 5-14 | 0.938 | 0.938 |
| 15-24 | 0.864 | 0.858 |
| 25-34 | 0.842 | 0.824 |
| 35-44 | 0.917 | 0.921 |
| 45-54 | 0.964 | 0.965 |
| 55-64 | 0.978 | 0.973 |
| 65-74 | 0.984 | 0.984 |
| 75-84 | 0.992 | 0.992 |
| 85 or over | 0.996 | 0.996 |
|
QUEENSLAND
|
| 5-14 | 0.948 | 0.948 |
| 15-24 | 0.920 | 0.910 |
| 25-34 | 0.881 | 0.864 |
| 35-44 | 0.937 | 0.935 |
| 45-54 | 0.968 | 0.968 |
| 55-64 | 0.980 | 0.979 |
| 65-74 | 0.985 | 0.986 |
| 75-84 | 0.992 | 0.992 |
| 85 or over | 0.995 | 0.995 |
|
SOUTH AUSTRALIA
|
| 5-14 | 0.944 | 0.946 |
| 15-24 | 0.910 | 0.909 |
| 25-34 | 0.896 | 0.876 |
| 35-44 | 0.930 | 0.932 |
| 45-54 | 0.973 | 0.975 |
| 55-64 | 0.987 | 0.984 |
| 65-74 | 0.990 | 0.991 |
| 75-84 | 0.995 | 0.995 |
| 85 or over | 0.998 | 0.998 |
|
WESTERN AUSTRALIA
|
| 5-14 | 0.915 | 0.916 |
| 15-24 | 0.893 | 0.893 |
| 25-34 | 0.840 | 0.817 |
| 35-44 | 0.895 | 0.898 |
| 45-54 | 0.948 | 0.952 |
| 55-64 | 0.975 | 0.972 |
| 65-74 | 0.983 | 0.983 |
| 75-84 | 0.991 | 0.990 |
| 85 or over | 0.996 | 0.995 |
|
TASMANIA
|
| 5-14 | 0.976 | 0.974 |
| 15-24 | 0.952 | 0.949 |
| 25-34 | 0.928 | 0.922 |
| 35-44 | 0.965 | 0.965 |
| 45-54 | 0.985 | 0.985 |
| 55-64 | 0.992 | 0.993 |
| 65-74 | 0.993 | 0.995 |
| 75-84 | 0.996 | 0.996 |
| 85 or over | 0.998 | 0.997 |
|
NORTHERN TERRITORY
|
| 5-14 | 0.941 | 0.939 |
| 15-24 | 0.928 | 0.920 |
| 25-34 | 0.873 | 0.842 |
| 35-44 | 0.912 | 0.917 |
| 45-54 | 0.955 | 0.962 |
| 55-64 | 0.972 | 0.970 |
| 65-74 | 0.981 | 0.985 |
| 75-84 | 0.987 | 0.985 |
| 85 or over | 0.984 | 0.993 |
|
AUSTRALIAN CAPITAL TERRITORY
|
| 5-14 | 0.922 | 0.921 |
| 15-24 | 0.862 | 0.853 |
| 25-34 | 0.867 | 0.844 |
| 35-44 | 0.906 | 0.909 |
| 45-54 | 0.951 | 0.956 |
| 55-64 | 0.969 | 0.966 |
| 65-74 | 0.982 | 0.982 |
| 75-84 | 0.991 | 0.990 |
| 85 or over | 0.998 | 0.997 |
|
Source: 2016 Estimated Resident Population
TABLE A.4. ESTIMATED PROPORTION OF 2016 CENSUS RESPONDENTS IN SCOPE OF THE 2011 CENSUS, By state/territory and Indigenous status
| State/Territory | Aboriginal and Torres Strait Islander persons
(no.) | Other persons(a)
(no.) |
|
| New South Wales | 0.996 | 0.927 |
| Victoria | 0.993 | 0.922 |
| Queensland | 0.996 | 0.941 |
| South Australia | 0.997 | 0.947 |
| Western Australia | 0.997 | 0.914 |
| Tasmania | 0.997 | 0.971 |
| Northern Territory | 0.999 | 0.894 |
| Australian Capital Territory | 0.988 | 0.914 |
|
(a) Includes non-Indigenous persons and persons who did not state an Indigenous status in 2016.
Source: 2016 Estimated Resident Population
At this point an intermediate weight was calculated for each linked sample record that was equal to (Design weight) x (Missed link adjustment). This intermediate weight was calibrated (or adjusted) so that the resulting weighted counts of the ACLD links would be equal to the estimated longitudinal population sizes in Table A.3 and A.4. The intermediate weights were calibrated using a 'raking' tool. This is a program which was developed to determine record level weights using iterative horizontal and vertical passes through the unit records until a satisfactory set of final weights are converged upon. Imposing bounds on the calibration adjustment was not necessary because extremely high or low final weights were not produced.
This calibration adjustment improves the accuracy of weighted estimates and it implicitly adjusts for the small proportion of people who were in scope for the 2011 Census but who did not complete a Census form in 2016.
Summary of weights
The mean weight for selected characteristics gives an indication of how much the final weight differs from the initial design weight (17.5) in order to address missed links and Census undercount. Table A.5 shows that the mean final weight for the linked records is 22.3 for females, and 23.2 for males. The largest weight was 83 and the smallest was 14.8. The mean weight was higher for Aboriginal and Torres Strait Islander persons (30.4) and for people in the Northern Territory (30.2).
TABLE A.5 - DESCRIPTIVE STATISTICS FOR WEIGHTS, by Selected Characteristics, 2016
| Count (a) | Minimum Weight | Maximum Weight | Mean Weight | Standard Deviation | Median Weight |
|
SEX
|
| Male | 450 054 | 14.8 | 83.1 | 23.2 | 4.9 | 22.0 |
| Female | 477 460 | 14.8 | 81.9 | 22.3 | 4.7 | 21.3 |
|
AGE
|
| 0-14 | 126 917 | 16.1 | 81.9 | 22.3 | 5.1 | 21.0 |
| 15-24 | 119 827 | 16.5 | 67.5 | 23.5 | 4.0 | 22.7 |
| 25-34 | 109 438 | 17.4 | 83.1 | 27.9 | 5.3 | 27.3 |
| 35-44 | 127 858 | 15.9 | 60.6 | 23.3 | 4.7 | 22.7 |
| 45-54 | 139 010 | 16.0 | 68.8 | 21.9 | 4.1 | 20.8 |
| 55-64 | 127 797 | 15.6 | 62.7 | 21.3 | 3.8 | 20.1 |
| 65-74 | 99 605 | 15.2 | 55.5 | 20.6 | 3.4 | 19.4 |
| 75-84 | 54 414 | 14.8 | 58.0 | 20.2 | 3.5 | 18.8 |
| 85 or over | 22 651 | 14.8 | 56.2 | 21.2 | 3.9 | 19.8 |
|
INDIGENOUS STATUS
|
| Aboriginal and/or Torres Strait Islander | 23 059 | 18.9 | 83.1 | 30.4 | 6.0 | 29.9 |
| Other (b) | 904 457 | 14.8 | 81.9 | 22.5 | 4.6 | 21.5 |
|
STATE/TERRITORY OF USUAL RESIDENCE
|
| New South Wales | 296 695 | 15.5 | 81.9 | 22.7 | 4.9 | 21.6 |
| Victoria | 234 629 | 15.7 | 80.5 | 22.7 | 4.7 | 21.6 |
| Queensland | 185 576 | 15.7 | 81.2 | 23.0 | 4.6 | 22.2 |
| South Australia | 71 025 | 14.8 | 68.7 | 21.5 | 4.3 | 20.3 |
| Western Australia | 95 198 | 15.4 | 73.8 | 23.0 | 5.2 | 21.7 |
| Tasmania | 21 781 | 15.9 | 58.8 | 21.8 | 3.8 | 20.7 |
| Northern Territory | 6 929 | 17.1 | 83.1 | 30.2 | 8.0 | 28.7 |
| Australian Capital Territory | 15 583 | 15.2 | 60.0 | 22.0 | 4.6 | 21.1 |
|
a) Counts presented in the table have been perturbed.
b) Includes non-Indigenous persons and persons who did not state an Indigenous status in 2016.
Source: ABS, Australian Census Longitudinal Dataset.
 Quality Declaration
  Print Page
 Print All