|
Family and community are important aspects of society, but the way in which they contribute to progress is difficult to define and measure. The quality and strength of people’s relationships and bonds with others - their family, friends and the wider community - are important ingredients of the level of social cohesion. And a more cohesive society is one in which communities are strong and inclusive, and where fewer people fall through the cracks.
Rather than present a single indicator, this commentary presents some measures which illustrate aspects of family and community life in Australia, particularly those that are important to social cohesion. |
Introduction
People are social beings. They require love, companionship and agreeable engagements with others (including those that involve the formal exchange of goods and services) to flourish. The absence of family, friendship or other caring or cooperative social relationships at any stage of life, but particularly when people are least able to care for themselves, can have a serious impact on personal wellbeing. And there are often high costs to the wider community associated with assisting people with poor or broken social relationships.
People's relationships and bonds with one
another - be it their family, friends or the wider community - together with their shared values contribute to social cohesion. The family unit takes on a large part of the burden of caring for people in need of support, and the vast range of services provided within communities by groups, clubs and charitable organisations are a crucial adjunct to the institutionalised care provided by governments. Families are responsible for providing guidance on social values which helps to form the basis of a civil society. Day to day interactions between people in a community build trust and reciprocity.
The discussion here focuses on the contribution that family and community functioning makes to social cohesion. There is no conceivable single indicator that captures all that might be important. Therefore a selection of indicators is presented that paint a picture of the way our families and communities function, and the cohesiveness of Australian society.
Families and family functioning
The family can be seen as the wellspring from which some of the dimensions crucial to social cohesion develop, such as trust, social support and the extension of social networks. It is also the place where, through the everyday performance of family life, people make an enormous contribution to those who require special assistance. Most of the care provided to children, and to people with a disability is provided by immediate and extended family members.
Social cohesion and related concepts
Social cohesion refers to the social ties and community commitments that bind people together.1 Closely related to the concept of social cohesion are the notions of 'social capital' and ‘social exclusion’.
Social capital consists of networks, together with shared norms, values and understandings which facilitate cooperation within and among groups. It is a contributor to community strength, and can be accumulated when people interact with one another formally and informally, for example informal interaction with family and friends and formal interaction in groups and organisations in the wider community.2
Social exclusion is a form of social disadvantage encompassing economic and non-economic factors. Excluded individuals and groups are separated from
institutions and wider society, and consequently from both rights and duties.3
Desired directions of change
Families have long been viewed as the core social unit that serves to maintain people's welfare. Over recent decades, the emphasis of debate has shifted from the maintenance of the ideal family form (earlier viewed as the so-called traditional family involving a married couple and their children), to one in which the quality of relationships between family members, irrespective of form, is viewed as being more important. Yet, to members of the community who hold on to traditional
values, the decline of traditional family structures may be viewed as regress.
Well established research suggests that there are positive health outcomes, such as greater longevity, from having high quality relationships with close family members and friends. It also suggests that other aspects of life (such as employment outcomes) are better for people with wide social networks.2
While views about ideal levels of social cohesion vary, for some aspects of social cohesion there is likely to be general agreement that change in a particular direction is good or bad. For instance, most would agree that decreases in the suicide rate, in the incidence of drug-induced deaths, or in the level of omelessness, represent improvements. But for many other aspects of social cohesion, the choice and interpretation of indicators may be problematic. |
Changing nature of the family
Over recent decades there have been extensive change in the way families are structured and function. These trends have a range of social implications. Later partnering, later child bearing and smaller family size have implications for the size and age profile of the population. The increasing propensity to live alone has implications for housing and support.
There is considerable interest in determining whether families are undergoing more transitions than in the past and what the implications of this might be. The impact of divorce and family breakup on families is of concern, as is the quality of relationships between children and parents, and children and step-parents.4
Family type
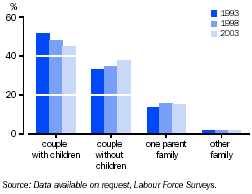
Types of families in Australia
According to the 2001 Census of Population and Housing, 83% of people lived in a family, 3% lived in group households, 9% lived alone, less than 1% were boarders living in a family home, and 4% were residing in institutions such as prisons, nursing homes, and hostels.
In 2003, there were over five million families in Australia. The most common type of family was a couple family with children (45%), followed by a couple family without children (38%). There were 821,800 one parent families which represented 15% of all families. In the years from 1993 to 2003, the proportion of one parent families increased from 14% to 15%. However, there has been a more marked increase in the proportion of children under 15 living in one parent families, which rose from 15% to 20% over ten years.
Largely due to the ageing of the population creating 'empty nesters', but also including trends towards childlessness, over the past decade the proportion of families with children has declined from 65% of families to 60%. The decline has been driven by couple families with children, which fell from 52% of families to 45% in this period.
Assuming these trends continue, by 2021 the most common family type is projected to change from couples with children to couples without children. Lone person households will also become more common. The number of lone person households is projected to increase from 1.6 million households in 1996 to between 2.4 million and 3.4 million households in 2021, increasing from 9% of the population to between 11% and 15% of the population.5
Family formation and dissolution
Ideally we would like to measure all family formation and dissolution, whether formed through registered or de facto marriages, and dissolved through divorces or separations. As such detailed family history data is not available we use registered marriage and divorce statistics.
Marriage and divorce
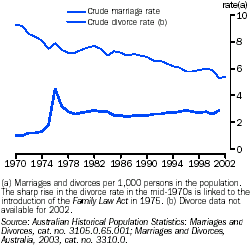
The commitment to a formal marriage (in a religious ceremony or by a civil celebrant) has become less popular. In 1970, the crude marriage rate stood at 9.3 marriages per 1,000 people. Between 1992 and 2002 the crude marriage rate declined from 6.6 to 5.4 marriages per 1,000 people, a continuation of a longer term trend.
The trend away from marriage is partly explained by a growth in the proportion of people who form de facto marriage relationships and a growth in people living without partners. Comparisons from the 1986 and 2001 Censuses of Population and Housing show that de facto couples as a proportion of all couples has doubled over the period, from 6% to 12%. Further comparisons from 1986 to 2001 show that the proportion of adults who did not have a partner (in either a legal marriage or a de facto marriage relationship) increased from 33% to 38%. The change was greater for younger people (those in the 18-34 year age range), but the proportion of people who were not living with a partner increased for each age group under 65.6
The dissolution of legal marriages through divorce has contributed to the increase in the proportion of people not living with a partner. However, while divorce rates increased over the decade up to 1996, the data indicate a decline in divorce rates from then until 2001, when they increased again. The decline in the latter half of the 1990s needs to be viewed in the context of the decline in the number of registered marriages.
In 2001, the crude divorce rate (2.9 divorces per 1,000 people) was higher than that in the preceding year (2.6 divorces per 1,000 people) and had returned to the longer term peak of 2.9 recorded in 1996.
Children and divorce
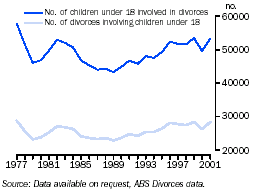
Impact of divorce and separation
An increase in the number of divorces may reflect a greater prevalence of unhappy marriages, or greater acceptance of dissolving unhappy marriages.
Divorce and separation of couples is a disruption to family life. Some families manage the transition well; others find it stressful. The process of adjusting to the new family circumstances can take differing lengths of time with some people feeling stressed by the divorce or separation years after it occured.
As the rate of divorces increases so too does the number of children experiencing parental divorce. Over the 10-year period from 1991-2001, there has been a steady increase in the number of children under 18 experiencing divorce. In 2001, approximately 53,400 children under 18 experienced divorce. In 1991, it was 46,700.
One of the impacts of divorce and separation on family structure is to create fewer families where children live with both natural parents. The proportion of families with children under 18 which were intact was 76% in 1992 and declined to 72% in 1997.7 Over the same period, while the proportion of step families and blended families with children under 18 stayed fairly similar in size (step families 4% and blended families 3%), the proportion of one parent families grew, as noted in the commentary on types of families in Australia.
One parent families are also more prone to disadvantage in a number of areas, and this is discussed in the article Multiple disadvantage.
Caring role of families
The care and support a family provides is a foundation for people's health and social functioning. Care and guidance take place within the family across the life cycle, beginning with parents (and sometimes grandparents) caring for children, and often ending with children caring for parents.
Raising children is a time consuming job. Figures from the 1997 Time Use Survey indicate that parents spend on average six and a half hours a day caring for children; for mothers this is over eight and a half hours a day while for fathers it is four hours a day. The largest component (65%) is low intensity, child minding activities.
Stress to families
Families and communities play a key role in raising capable and functioning people. When considering the relationship of the family to progress it might be ideal to find indicators which measure how effectively families undertake this role. Such data are not available, although some key outcomes of family life, such as whether people behave well in society, achieve good educational and work outcomes are measured by other indicators in this publication (Crime, Work and Education). Instead we discuss some of the stresses which can threaten the optimal functioning of the family unit. Families can experience a range of pressures: the dissolution through relationship breakdown has already been discussed. Other factors widely regarded as key include: the quality of parent-child relationships (both resident and non-resident), financial stress, conflict between parent figures, parental mental health and substance use, and abuse or neglect of children.8
Feeling pressed for time is one important stressor for which we have data. Parents with small children feel the greatest amount of time pressure. Over 60% of mothers living in couple relationships, with a youngest child aged 0-4 years old, always feel pressed for time. For fathers in the same family type, it is 52%. The reporting of always feeling time stressed decreases as children age, with 48% of mothers and 34% of fathers in couple families, whose youngest child is aged 15-24 years old reporting always feeling pressed for time. By the time the children are over 25 years of age, 35% of mothers and 23% of fathers report always feeling time stressed. For fathers this is in line with the experience of adults who live in households with no children present.
The job of raising children is complex. And if one or both parents suffers from illness or psychological distress this may result in poor outcomes for children.9 In the 2001 National Health Survey, 13% of mothers and 9% of fathers in couple families reported high or very high psychological distress. For lone mothers the proportion expressing high or very high psychological distress was almost double that of mothers in couple families (23%). While some mothers with very young children suffer from post-natal depression, the proportion of mothers with children younger than five reporting high or very high psychological distress was much the same as that for mothers with children aged 10-14 (14% and 13% respectively).
Young adults (18-24) living in one parent families report higher distress than young adults living in couple families. This is particularly true for young men in one parent families who were twice as likely to report high psychological distress (18% compared with 9%). |
Developmental activities such as playing with children take, on average, an hour of a parent's day, with mothers and fathers spending proportionally the same amount of their child care time playing with their children (15%). On the other hand mothers spend 15% of their child care time providing such physical care as feeding, bathing, and dressing children, compared with 8% for fathers.
Primary carers of the elderly and disabled, 1998
|
| Relationship to recipient | Recipient of care | no. |
|
| Wife | Lives with | 105,480 |
| Husband | Lives with | 85,385 |
| Mother | Lives with | 82,279 |
| Daughter | Does not live with | 47,866 |
| Daughter | Lives with | 36,609 |
| Son | Lives with | 15,276 |
| Son | Does not live with | 12,373 |
| Other female | Does not live with | 10,946 |
| relative |  |  |
| Father | Lives with | 10,411 |
| Female friend/neighbour | Does not live with | 9,362 |
|
 |  |  |
| Total(a) |  | 450,858 |
|
(a) Total Includes other relationships not defined in list above.
Source: Data available on request, Survey of Disability, Ageing and Carers 1998.
|
When mothers work outside the house, in paid employment, the contact time between them and children reduces. Recent research indicates that, on the whole, mothers choose to maintain the time spent on developmental activities while substantially reducing low intensity, child minding activities. As mother's hours of paid work increase, fathers increase slightly the time they spend with children in developmental activities and in low intensity care.10
Families also often care for elderly and disabled relatives. In 1998, the Survey of Disability, Ageing and Carers identified that there were over 450,000 people who were primary carers. A primary carer is a person of any age who provides the most informal assistance, in terms of help or supervision, to a person with one or more disabilities. Most of these carers (79%) lived with the person requiring care. And it is a role that most often falls to the immediate family: 89% of primary carers were either a partner, parent or offspring. While many husbands, fathers and sons do provide care, 70% of primary carers were women.
Given some of the trends outlined in this chapter and in the Population and Work chapters (ageing of the population, declining fertility rate, increased female labour force participation and relationship breakdown) there are some concerns about the future availability of carers.11
NOTE: In Measures of Australia's Progress, the graph and some of the commentary relating to 'Children without an employed parent' incorrectly included information relating to children in jobless households. Other commentary incorrectly referred to numbers of parents.
Children living without an employed parent
The number of children living without an employed parent is related in part to the structure of the labour market, and in part to the changing structure of Australian families. Children living without an employed parent are a source of particular concern, both because the joblessness is an indicator that the children are at greater risk of experiencing financial hardship and because the joblessness may also have impacts on their psychological wellbeing and long-run personal development.
While studies have shown that there are correlations between someone's childhood circumstances and adult outcomes, there is ongoing debate about the causal relationships involved. It is difficult to obtain all the data needed to fully examine the impacts of and inter- relationships between inherited capabilities, parental and other care, role-models (both parental and other), education, childhood health, income levels, etc. It is also important to note that while studies point to a higher incidence of poor outcomes the results do not suggest simple deterministic patterns — that is while there may be higher risks, such childhood experiences do not necessarily result in adverse outcomes.12
The accompanying chart shows that, since the mid 1990s, the proportion of children living without an employed parent in the same household has been relatively steady at between 16% and 19%. Over half these children lived in one parent families (even though one parent families only accounted for 20% of all children in 2000–01), and about one-third lived in one parent families in which the youngest child was under 5.
In 2000-01, in sole parent families where the youngest child was under 5, 79% of children were living with a jobless parent. This compares to 46% of children in sole parent families where the youngest child was between 5 and 14. In contrast, 55% of children living in couple families had both parents employed.
The longer term effects on children are likely to be greater if the period of joblessness is extended, and may differ depending on the circumstances of the joblessness. For example, if a parent undertakes study, the economic wellbeing of the household may be improved later on. Also, the impact of parental joblessness may be offset if other household members are employed. |

People's contact with family and friends
Relationships with family and friends are the basis of the informal networks operating in society. Interaction is key to the maintenance of these networks and provides the opportunity to generate trust. Strong networks in turn act as a reservoir for support.
In the 2002 General Social Survey, most people (95%) reported having contact in the previous week (either in person or via telephone, mail or email) with family or friends outside their household. There was little variation across age groups or between men and women. Less than 1% of people had had no contact with family or friends outside the home, in the previous month.
More people are living alone and time spent alone is also increasing. Adults, of all ages, are increasingly more likely to live alone. Between 1992 and 2002, the proportion of people aged 15-64 years who lived alone increased from 6% to 9%. Among those aged 65 years and over it increased from 29% to 30%.13
Partly associated with more people living alone, people are also spending more of their time alone. Between 1992 and 1997, the average waking time per week spent alone among people aged 15 years and over increased from a little under 18½ to a little over 21 hours. The increases occurred in most age groups, but were typically greater among men than women, and greatest among people who lived alone.14
Social participation
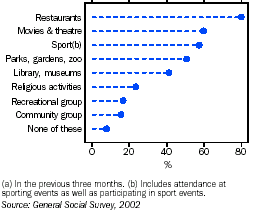
Most people participate in social activities of one kind or another. In 2002, most Australians living in private dwellings (92%) participated in at least one of a nominated set of social activities in the three months prior to being surveyed. Popular activities were going out to restaurants (80% of people), attending movies (60%), attending or participating in sporting events (57%), visiting parks, zoos and theme parks (51%). Not surprisingly, as people age they are less likely to participate in such social activities. By 75 years and over, 21% of people did not participate in any of the nominated social activities in the previous three months.
Involvement in paid employment provides an important means of meeting, and developing relationships with, a more diverse range of people. As noted in the commentary Work, there have been changes in the levels of labour force participation of both men and women (decreasing for men and increasing for women) which suggests that women have more work-related social contacts than in the past. In 2002, 8% of unemployed people had had no contact with friends and family outside the household in the previous week. Only 4% of employed people and 6% of people not in the labour force had had no contact. Unemployed people were also much more likely to feel they did not have the ability to ask for small favours from persons outside the household (12% compared with 5% for employed people).
Social participation by adults in 2002(a)
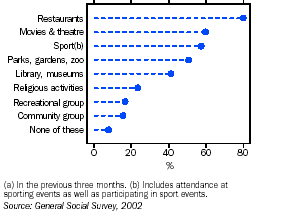
No participation in selected social activities(a)(b), 2002
Undertaking voluntary work is another way in which people meet and interact with one another, and this is discussed in the next section.
Levels of participation in organised, non-organised and social sport or physical activities grew during the 1990s. In 2002, 65% of men and 60% of women had participated in sport or physical activities at some time during the previous 12 months.
According to the 2002 General Social Survey (GSS), 23% of Australian adults participated in church or religious activities during the three months prior to interviewing. Women (26%) were more likely than men (20%) to have participated in church or religious activities. Female participation was higher than male participation among all age groups but for both, participation increased with age.
Participation in religious activities, 2002
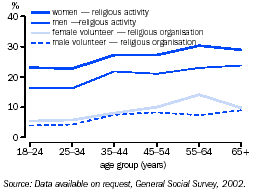
In 2002, adults who had participated in church or religious activities within the three months prior to the survey were much more likely to have undertaken voluntary work than those who did not participate (52% to 29%). In particular, they were twice as likely to have volunteered for a welfare or community organisation than those who had not participated in religious activities (18% compared with 9%), and were also more likely to volunteer for an organisation providing education, training or youth development (12% compared with 7%).15
Trust
Trust and trustworthiness are two sides of the same coin, acting to lubricate social interaction and the smooth functioning of society. Trust refers to confidence in the reliability of a person or a system. It is based on the expectation that people or organisations will act in ways that are expected or promised, and will take into account the interest of others. Trustworthiness involves honesty, accountability, fair dealing and a level of competence.17
Trust is widely regarded as an important element of social capital, and, therefore, an important part of social cohesion. The ABS does not collect data about trust, per se, although the 2002 GSS collected information on people’s feelings of safety at home, which sheds some light on trust in Australia. About 82% of people reported feeling very safe or safe at home alone after dark, with the rate higher for men (91%) than women (72%).
Reciprocity
Reciprocity can be defined as any relationship between two people (or groups of people) where there is a giving and taking. It can be regarded as the general expectation that assistance or support may be returned at some undefined time in the future. Examples of reciprocal actions include contributing time or money to the community, making charitable donations, and sharing support among friends and family. One important and widespread expression of reciprocity is that which occurs over time in families, with reciprocal provision of support that occurs between different family members. Reciprocity is important to social cohesion: a society in which reciprocity is strong may also encourage the sharing of support, knowledge, and ideas between individuals, groups and communities. In a community where reciprocity is strong, people care for each other's interests. The expectation of reciprocity may make people more willing to behave cooperatively or altruistically.17
In 2002, most people (93%) felt they could ask people outside their household for small favours, such as looking after pets, collecting mail, watering gardens, minding a child for a brief period, or borrowing equipment. Overall, there were no significant differences between men and women in being able to ask for small favours.
The picture is much the same for people’s ability to access support from outside the household in times of crisis, with 94% of people reporting they would have support. The greatest source of potential support is family members (82% of people thought their family would help), friends (66%) followed by neighbours (34%) and work colleagues (21%).
Some groups in Australia do report lower levels of ability to access support in times of crisis. People who were born overseas and not proficient in English were more likely to report an inability to access support than people born in Australia (14% felt they could not access support compared with 5%). Some 11% of people aged under 65 with a disability resulting in a core activity restriction felt they could not access support in times of crisis. |
Community support
Strong community bonds can be formed through things like volunteering and donating money to groups and organisations in the community. Such networks may involve people who do not normally associate with one another, and in this way help to form bridging relationships between these community members. When the support offered by people's families and communities declines or is absent, it can contribute to serious social exclusion and problems such as homelessness, suicide and deaths from drug taking.
Building social support
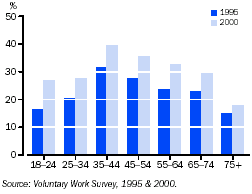
The likelihood that people will voluntarily give their time to do some work for an organisation or group might be regarded as one of the stronger expressions of social capital, as it involves providing assistance, fulfilling needs and providing opportunities in the community. Participation in voluntary work also reinforces networks and adds to the richness of community life. Between 1995 and 2002, the proportion of people aged 18 years and over who reported that they did some voluntary work during the previous 12 months increased from 24% to 34%. The increases occurred for both sexes and across all age groups, but were proportionately greater for those in the age groups 18-24 (17% to 28%) and 55-64 (24% to 38%).16
Proportions of people volunteering by age
Another indicator of community support is the willingness to donate money or goods to community groups or charities. The Business Generosity Survey showed that in 2002, some 36% of operating businesses made donations, 4% participated in supporting community projects, and 11% sponsored individuals or charities. Some businesses did all three.
Making donations of money to disaster relief funds, charities or groups or organisations in the community is common. In 2000, 74% of adults donated money to an organisation. Women were more likely than men to donate (77% compared with 72%) and 80% of people aged between 35-54 donate. Those most likely to donate money were people already donating their time, with 84% of volunteers donating money.18
Breaking the bonds of social support
When the bonds between people are sufficiently weakened by stresses such as mental illness, abuse, destructive and self-destructive behaviours, individuals may permanently or temporarily become alienated or marginalised from families and social support networks. Deaths as a result of suicide or drug taking and homelessness provide pointers to a disintegration of social support, and hence social cohesion.
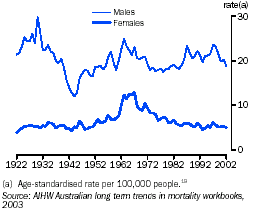
Suicide deaths(a)
Homelessness
Homelessness might be seen as an indicator of poor social cohesion. Homeless people are without settled accommodation and do not have access to the economic and social support that a home normally affords. Of course, there are many, often interrelated, personal and situational factors that may cause people to become or remain homeless. These include family breakdown, drug abuse, gambling, mental health problems, domestic violence and poverty.
People experiencing homelessness can stay in any number of places, including sleeping rough, staying in stop gap accommodation (with friends or in community refuges for those in crisis situations) or in other low cost accommodation (such as rooms in boarding houses). As a result it is very difficult to measure the numbers of people involved. Nevertheless, there have been some attempts to provide authoritative estimates. Those prepared by Chamberlain, MacKenzie and the ABS, based on the 2001 Census of Population, estimated almost 100,000 homeless people in Australia on Census night 2001. Of these, approximately 14,000 were sleeping rough and nearly half (48,600) were staying with friends and relatives.20 The estimate of homeless people, using the 1996 Census of Population was 105,000 people. As an indicator of the difficulty experienced in counting the homeless, in 1997 researchers of the Consilium group, using different methodologies to those used in the Chamberlain/ABS study produced a smaller estimate of 53,000 people.21
Information obtained from community organisations providing crisis accommodation and support services (compiled by the Australian Institute of Health and Welfare) indicate that greater numbers of clients received daily support in 2002-03 (about 21,100 to 22,500 per day) than in 1996-97 (about 13,000 to 14,000 per day).22 But these numbers are understood to represent only a fraction of homeless people in Australia on any one day, and may be influenced by an increased willingness to use such services. They cannot by themselves be taken as reliable evidence of deteriorating levels of social attachment. |
The suicide rate is one widely used indicator of social cohesion.23 While many complex factors might influence a person's decision to take his or her own life, suicide points to a loss of will to live as part of society and an inability of others to ensure that the person's sense of wellbeing was maintained. The prevalence of drug-induced deaths is used as another indicator of social cohesion for similar reasons. While such deaths can occur for many reasons, their occurrences point to individuals who may not be well integrated into a supportive community.
The annual, age standardised, suicide rate has fluctuated substantially over the last century, with the long term ups and downs being more the result of changes in the male suicide rate, which has been more volatile and consistently higher than the female rate. Despite a recent fall in the male suicide rate to 18.8 suicide deaths per 100,000 men in 2002, the general shift from the relatively low rates recorded through the 1970s to higher rates in the late 1980s and 1990s stands in contrast to the downward shift in female rates since the 1970s.
Youth suicide deaths(a)
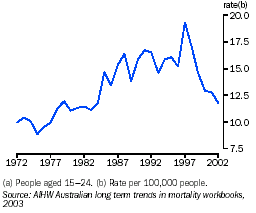
For young people aged 15-24, the suicide rate showed a period of steady increases in the late 1980s through to the peak of 19.3 suicides per 100,000 people in 1997. Since then it has declined sharply to the current rate in 2002 of 11.8 suicides per 100,000 people. A rate last experienced in 1984.
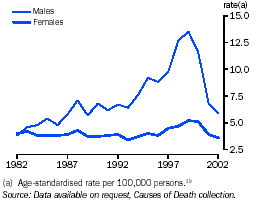
Drug-induced death rates are mostly due to the use of opiates such as heroin.24 Like suicide, the drug-induced death rate for women has been relatively low and stable over the last two decades, but for men the trend has been quite different. Starting at similar levels as for women in 1982 (about four deaths per 100,000 people), by 1990 the male rate had grown close to seven deaths per 100,000. After remaining stable at about the 1990 level for several years, it rapidly doubled to 14 deaths per 100,000 men in 1999, falling to 6 deaths per 100,000 men in 2002.
For women, on the other hand, the drug-induced death rate at the end of the 20-year period was the same as the beginning (4 and 3.6 per 100,000 women in 1982 and 2002, respectively). The fluctuations over time for women show periods of relative stability with a peak in 1999 of 5 deaths per 100,000 women, and some decline in recent years.
Drug-induced deaths(a)25
Links to other dimensions of progress
See also the commentaries Crime, Health, Work, Financial hardship, Multiple disadvantage, Culture and leisure, and Democracy, governance and citizenship.
Endnotes
1. Berger-Schmitt, R. and Noll, H. 2000, Conceptual Frameworks and Structure of a European System of Social Indicators, EU Reporting Working Paper
No. 9, Centre for Social Research and Methodology, Mannheim.
2. Organisation for Economic Co-operation and Development (OECD) 2001, The Wellbeing of Nations: The Role of Human and Social Capital, Education and Skills, OECD Centre for Educational Research and Innovation, Paris, France.
3. Jary, D. and Jary, J. 2000, Collins Dictionary of Sociology, Harper Collins Publishers, Glasgow.
4. Rodgers, B. 1996, 'Social and psychological wellbeing of children from divorced families: Australian research findings', Australian Psychologist 31, pp. 174-182.
5. Australian Bureau of Statistics 1999, Household and Family Projections 1996 to 2021, cat. no. 3236.0, ABS, Canberra.
6. Australian Bureau of Statistics 2000, 'People without partners', pp. 43-46 in Australian Social Trends, 2000, cat. no. 4102.0, ABS, Canberra.
7. Data on intact families is only available from the Characteristics of Families Survey 1992 & 1997. The next Characteristics of Families Survey, which was undertaken in 2003, is due for publication in 2004.
8. Pryor, J. and Rodgers, B. 2001, Children in Changing Families: Life after Separation, Blackwell Publishers, Great Britain.
9. Silburn, S., Zubrick, S., Garton, A., Gurrin, L., Burton, P., Dalby, R. et al, 1996, Western Australia Child Health Survey: Family and Community Health, ABS and TVW Telethon Institute for Child Health Research, Perth.
10. Bittman, M., Craig, L. and Folbre, N. 2003 'What happens when children receive non-parental care?', pp. 133-151, in Bittman, M., Craig, L. and Folbre, N. (eds) Family Time: Social Organisation of Care, Routledge, New York.
11. Australian Institute of Health and Welfare, 2003, Australia's Welfare 2003, pp. 106-113, AIHW cat. no. AUS 41, AIHW, Canberra.
12. See, for example: Dawkins, P., Gregg, P, and Scutella, R. 2002, 'The growth of jobless households in Australia', Australian Economic Review, vol. 35(2), pp. 133-154; and Gregory, R. 1999 Children and the Changing Labour Market: Joblessness in Families with Dependent Children, Discussion Paper No. 406, Centre for Economic Policy Research, Australian National University.
13. Statistics on proportions of people living alone are published in Family and community: national summary, pp. 28-29, in Australian Social Trends 2003, cat. no. 4102.0, ABS, Canberra.
14. Australian Bureau of Statistics 1999, 'Spending time alone', pp. 35-38 in Australian Social Trends, 1999, cat. no. 4102.0, ABS, Canberra.
15. Australian Bureau of Statistics 2004, 'Religious affiliation and activity', in Australian Social Trends, 2004, cat. no. 4102.0, ABS, Canberra. Due for publication mid-2004.
16. Australian Bureau of Statistics 2001, Voluntary Work, 2000, cat. no. 4441.0, ABS, Canberra. Also, Australian Bureau of Statistics 2003, General Social Survey,
cat. no. 4159.0, ABS, Canberra.
17. Australian Bureau of Statistics 2004, Information Paper: Measuring Social Capital: An Australian Framework and Indicators, cat. no. 1378.0, ABS, Canberra.
18. Australian Bureau of Statistics 2001, Voluntary Work, 2000, cat. no. 4441.0, ABS, Canberra.
19. Standardised death rates enable comparisons of death rates between populations of different age structures by relating them to a standard population. Death rates have been standardised to the 2001 total population.
20. Chamberlain, C. and MacKenzie, D. 2003, Australian Census Analytic Program: Counting the homeless, 2001, cat. no. 2050.0, ABS, Canberra.
21. Consilium Group 1998, Estimating the Number of Homeless People in Australia, FaCS, Canberra.
22. Australian Institute of Health and Welfare (AIHW) 2003, Homeless People in SAAP, SAAP National Data Collection Annual Report 2002-03 Australia. AIHW
cat. no. HOU 91, AIHW, Canberra.
23. Organisation for Economic Co-operation and Development (OECD) 2001, Society at a Glance: OECD Social Indicators, OECD, Paris.
24. For further analysis, see ABS 2001, 'Drug-induced deaths', pp. 71-74 in Australian Social Trends, 2001, cat. no. 4102.0, ABS, Canberra.
25. Drug-induced deaths are those caused directly or indirectly by drug abuse, including deaths from organ damage caused by drugs. They include deaths from illegal drugs as well as the misuse of legal drugs.
Excluded from the death rates presented in this commentary are: deaths directly attributable to alcohol and tobacco use; deaths from poisoning or exposure to volatile organic compounds (such as petrol); and murder where drugs were the weapon. Also excluded are deaths such as some road traffic accidents or AIDS deaths where drug use partly contributed to the death.
Deaths from 1980 to 1998 were classified according to the International Statistical Classification of Diseases Ninth Edition (ICD-9), while deaths from 1999 were classified according to the Tenth Edition (ICD-10). The drug-induced deaths from these different classifications have been matched to facilitate comparisons over time.
In this article, drug-induced deaths include the following categories from the ICD-10:
suicide by drugs (X60-X64)
accidental drug-induced deaths, which include two components: accidental poisoning by drugs (X40-X44) and mental and behavioral disorders due to drug use (F11-F16, F19 & F55)
drug deaths where the intent of the poisoning was undetermined (Y10-Y14).
 Print Page
 Print All