DEATHS 2001-2005
For the period 2001-2005, there were 7,544 registered deaths identified as Indigenous (4,329 males and 3,215 females) for people reported to have been usual residents of Queensland, Western Australia, South Australia and the Northern Territory. These deaths accounted for 3.2% of all deaths of usual residents of these four jurisdictions.
Age at death
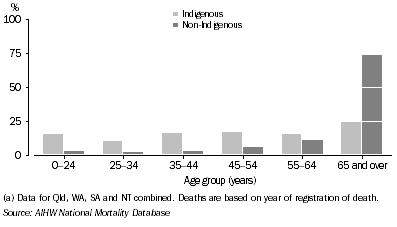
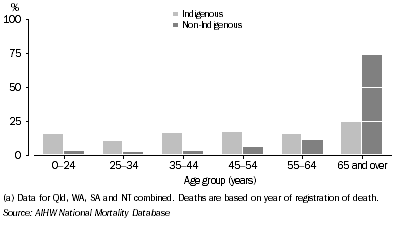
In Queensland, Western Australia, South Australia and the Northern Territory combined, approximately 75% of Indigenous males and 65% of Indigenous females died before the age of 65 years. This is in stark contrast to the non-Indigenous population where only 26% of males and 16% of females died aged less than 65 years (graphs 9.4 and 9.5).
Infant deaths (deaths under one year) contribute to the younger age at death of the Indigenous population. For the period 2001-2005, Indigenous infant deaths represented 6.4% of total Indigenous male deaths and 5.7% of total Indigenous female deaths compared with 0.9% and 0.8% of the total for non-Indigenous male and female infant deaths.
The 35-44 year age group accounted for 16% of total Indigenous male deaths compared with only 3% of total non-Indigenous male deaths, while the 45-54 year age group accounted for 15% of Indigenous female deaths compared with 4% of total non-Indigenous female deaths.
9.4 MALE DEATHS(a), by Indigenous status and age
- 2001-2005

9.5 FEMALE DEATHS(a), by Indigenous status and age
- 2001-2005

For the four jurisdictions included in this analysis, Indigenous Australians were over-represented in mortality statistics, in almost every age group. Table 9.6 shows Indigenous deaths as a proportion of total deaths by age group in 2001-2005 and their respective proportions of the total population for the same period.
9.6 DEATHS OF INDIGENOUS PERSONS(a) - 2001-2005 |
|  |
 | Number of Indigenous deaths | Indigenous deaths as a proportion of total deaths (%) | Indigenous persons as a proportion of total population (%)(b) |  |
| Age group (years) | Males | Females | Males | Females | Males | Females |  |
|  |
| Less than 1 | 277 | 182 | 20.3 | 17.2 | 7.7 | 7.7 |  |
| 1-4 | 54 | 50 | 16.2 | 21.3 | 7.3 | 7.5 |  |
| 5-14 | 54 | 40 | 13.5 | 14.5 | 6.9 | 6.8 |  |
| 15-24 | 285 | 130 | 12.4 | 15.3 | 5.1 | 5.4 |  |
| 25-34 | 452 | 218 | 13.8 | 17.4 | 4.1 | 4.4 |  |
| 35-44 | 695 | 435 | 15.0 | 16.6 | 3.0 | 3.3 |  |
| 45-54 | 742 | 498 | 9.1 | 10.0 | 2.1 | 2.3 |  |
| 55-64 | 671 | 523 | 4.6 | 6.4 | 1.4 | 1.6 |  |
| 65 and over | 1 075 | 1 122 | 1.2 | 1.2 | 0.8 | 0.9 |  |
| Total(c) | 4 329 | 3 215 | 3.5 | 2.8 | 3.8 | 3.9 |  |
|  |
| (a) Data for Qld, WA, SA and NT combined. Deaths are based on year of registration of death. |
| (b) Estimates of the Indigenous population for 2001-2005 are the Indigenous population projections, based on the 2001 Census of Population and Housing. |
| (c) Includes deaths where age was not stated. |
| Source: AIHW National Mortality Database |
Infant deaths
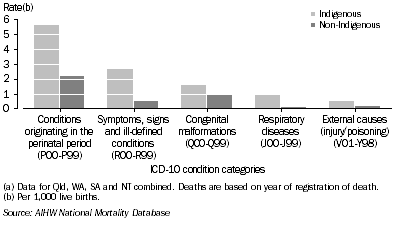
Infant deaths are deaths of live-born children which occur before they reach their first birthday. In 2001-2005, for Indigenous infants in Queensland, Western Australia, South Australia and the Northern Territory, the mortality rate for males and females was two to three times that for non-Indigenous male and female infants (table 9.8). Almost half (44%) of total infant deaths were due to conditions originating in the perinatal period - conditions related to the foetus and newborn affected by complications of pregnancy, labour and delivery, and disorders related to length of gestation and foetal growth. Symptoms, signs and ill-defined conditions, including Sudden Infant Death Syndrome (SIDS), were responsible for 22% of infant deaths, and congenital malformations accounted for 12%. For respiratory diseases and external causes (mainly accidents), which accounted for a further 8% and 4% of infant deaths, the mortality rates for Indigenous infants were 11 and 4 times those of non-Indigenous infants respectively (graph 9.7). Infectious and parasitic diseases were the sixth most common cause of death among Indigenous infants accounting for almost 4% of infant deaths. Indigenous infants died from infectious and parasitic diseases at around five times the rate of non-Indigenous infants. See Chapter 6 for further information on infant deaths.
9.7 MAIN CAUSES OF INFANT DEATHS(a), by Indigenous status
- 2001-2005

Age-specific death rates
In Queensland, Western Australia, South Australia and the Northern Territory combined, age-specific death rates for Indigenous males and females across all age groups were higher than the rates for non-Indigenous males and females (table 9.8). The age-specific death rates for Indigenous Australians were at least twice those experienced by the non-Indigenous population in all age groups except those aged 65 years and over. The greatest differences occurred among those in the 35-44 and 45-54 year age groups, where the rates for Indigenous males and females were five to six times those recorded for non-Indigenous males and females (table 9.8).
9.8 AGE-SPECIFIC DEATH RATES(a)(b), by Indigenous status - 2001-2005 |
|  |
 | Males | Females |  |
| Age group (years) | Indigenous rate | Non-Indigenous rate | Rate ratio(c) | Indigenous rate | Non-Indigenous rate | Rate ratio(c) |  |
|  |
| Less than 1(d) | 14.3 | 4.6 | 3.1 | 9.5 | 3.9 | 2.4 |  |
| 1-4 | 74.1 | 29.2 | 2.5 | 70.8 | 20.4 | 3.5 |  |
| 5-14 | 29.3 | 13.6 | 2.2 | 23.1 | 9.7 | 2.4 |  |
| 15-24 | 207.0 | 76.4 | 2.7 | 95.0 | 28.5 | 3.3 |  |
| 25-34 | 415.5 | 106.6 | 3.9 | 185.9 | 39.8 | 4.7 |  |
| 35-44 | 824.2 | 141.5 | 5.8 | 468.8 | 77.4 | 6.1 |  |
| 45-54 | 1 384.7 | 285.3 | 4.9 | 847.8 | 173.3 | 4.9 |  |
| 55-64 | 2 530.7 | 715.0 | 3.5 | 1 711.7 | 411.6 | 4.2 |  |
| 65 and over | 6 251.1 | 4 319.9 | 1.4 | 4 961.3 | 3 687.0 | 1.3 |  |
|  |
| (a) Data for Qld, WA, SA and NT combined. Deaths are based on year of occurrence of death for 1999-2002 and year of registration of death for 2003. |
| (b) Per 100,000 population. |
| (c) Rate for Indigenous Australians divided by the rate for non-Indigenous Australians. |
| (d) Per 1,000 live births. |
| Source: AIHW National Mortality Database |
 Print Page
 Print All