Services funded under the Commonwealth-State/Territory Disability Agreement (CSTDA) are designed for people who need ongoing support with everyday life activities. Under this agreement the Australian Government has responsibility for planning, policy setting and management of employment services, while the states and territories have responsibilities for all other disability services. These include:
- accommodation support - services that provide accommodation to people with a disability and services that provide the support needed to enable a person with a disability to remain in his or her existing accommodation or move to more suitable or appropriate accommodation.
- community support - services that provide the support needed for a person to live in a non-institutional setting, including therapy, early childhood intervention, counselling and case management.
- community access - services that provide opportunities for people with a disability to gain and use their abilities to enjoy their full potential for social independence.
- respite - services that provide a short-term break for families and other voluntary caregivers of people with disabilities, while providing a positive experience for the person with a disability.
Advocacy, print disability and information services are considered shared responsibilities of the Australian Government and the states and territories.
Information about disability services provided to the Aboriginal and Torres Strait Islander population can be obtained from the National Minimum Data Set (NMDS) collected by agencies funded under the CSTDA. This data set, which contains the standard question about Indigenous status, is collected by all jurisdictions and reported to the AIHW annually. Up until 2002, the CSTDA National Minimum Data Set was based on data collected on a single ‘snapshot’ day; however, data are now collected on an ongoing, financial year basis, with the 2003-04 data set being the first full year of data available. Thus the data presented below are not directly comparable to the 2002 snapshot data described in the last report of this series (ABS & AIHW 2003).
During 2003-04, an estimated 187,806 people (referred to as ‘service users’) were provided with CSTDA-funded services. Of these service users, 3.5% (6,524 service users) reported that they were of Aboriginal or Torres Strait Islander origin compared with their 2.7% share of people aged less than 65 years in the Australian population. The Indigenous status of 17,882 service users (10%) was not known.
The proportion of Indigenous people who received CSTDA-funded services varied by service type (table 11.9).
Respite (5%), community support (5%) and accommodation (4%) services had an above-average proportion of Indigenous service users. On the other hand, service users of employment (3%) and community access (3%) services had a smaller Indigenous representation than in the overall CSTDA service population.
11.9 Users of CSTDA-funded services, by Indigenous status and service(s) used - 2003-04(a) |
|  |
 | Indigenous | Other(b) | Total |  |
 | no. | % | no. | % | no. | % |  |
|  |
| Accommodation support | 1 257 | 3.8 | 31 918 | 96.2 | 33 175 | 100.0 |  |
| Community support | 3 597 | 4.6 | 75 250 | 95.4 | 78 847 | 100.0 |  |
| Community access | 1 325 | 2.8 | 46 311 | 97.2 | 47 636 | 100.0 |  |
| Respite | 1 064 | 5.2 | 19 483 | 94.8 | 20 547 | 100.0 |  |
| Employment | 1 677 | 2.6 | 62 604 | 97.4 | 64 281 | 100.0 |  |
| All service groups(c) | 6 524 | 3.5 | 181 282 | 96.5 | 187 806 | 100.0 |  |
|  |
| (a) Service user data are estimates after use of a statistical linkage key to account for individuals who received services from more than one service type outlet during the 12 months from 1 July 2003 to 30 June 2004. |
| (b) Includes 17,882 service users whose Indigenous status was not stated. |
| (c) Components do not add to total since persons may have accessed more than one service during the 12 month period. |
| AIHW 2005i |
Data on the support needs of CSTDA service users relating to nine life areas were collected. These areas were grouped into three main categories as follows:
- Activities of daily living (ADLs) - including self-care; mobility; and communication.
- Activities of independent living (AILs) - including interpersonal interactions and relationships; learning, applying knowledge and general tasks and demands; and domestic life.
- Activities of work, education and community living (AWECs) - including education; community (civic) and economic life; and working. This category is analysed for service users aged five years or over, as service users under five years of age are allowed to respond ‘not applicable due to age’ for all three of these life areas.
Aboriginal and Torres Strait Islander service users reported a somewhat more frequent need for support than other service users in all three of the support categories (table 11.10).
11.10 Users of CSTDA-funded services, by Indigenous status and support needed - 2003-04(a) |
|  |
 | Indigenous | Other(b) | Total |  |
| Frequency of support needed | no. | % | no. | % | no. | % |  |
Activities of Daily Living(c) |  |
|  |
| Always or unable to do | 1 889 | 34.9 | 36 917 | 27.8 | 38 806 | 28.1 |  |
| Sometimes | 2 473 | 45.7 | 60 963 | 45.9 | 63 436 | 45.9 |  |
| None, but uses aid(s) | 174 | 3.2 | 5 930 | 4.5 | 6 104 | 4.4 |  |
| None | 871 | 16.1 | 28 933 | 21.8 | 29 804 | 21.6 |  |
| Total | 5 407 | 100.0 | 132 743 | 100.0 | 138 150 | 100.0 |  |
Activities of Independent Living(d) |  |
|  |
| Always or unable to do | 2 281 | 42.3 | 44 567 | 33.9 | 46 848 | 34.2 |  |
| Sometimes | 2 625 | 48.7 | 71 020 | 54.0 | 73 645 | 53.8 |  |
| None, but uses aid(s) | 114 | 2.1 | 3 303 | 2.5 | 3 417 | 2.5 |  |
| None | 372 | 6.9 | 12 727 | 9.7 | 13 099 | 9.6 |  |
| Total | 5 392 | 100.0 | 131 617 | 100.0 | 137 009 | 100.0 |  |
Activities of Work, Education and Community Living(e) |  |
|  |
| Always or unable to do | 2 586 | 49.9 | 53 544 | 41.9 | 56 130 | 42.2 |  |
| Sometimes | 2 206 | 42.6 | 62 395 | 48.8 | 64 601 | 48.6 |  |
| None, but uses aid(s) | 115 | 2.2 | 3 655 | 2.9 | 3 770 | 2.8 |  |
| None | 274 | 5.3 | 8 228 | 6.4 | 8 502 | 6.4 |  |
| Total | 5 181 | 100.0 | 127 822 | 100.0 | 133 003 | 100.0 |  |
|  |
| (a) Service user data are estimates after use of a statistical linkage key to account for individuals who received services from more than one service type outlet during the 12 months from 1 July 2003 to 30 June 2004. |
| (b) Includes 17,882 service users whose Indigenous status was not stated. |
| (c) Self-care; mobility; and communication. Excludes 49,656 service users whose support needs were not stated. |
| (d) Interpersonal interactions and relationships; learning, applying knowledge and general tasks and demands; domestic life. Excludes 50,797 service users whose support needs were not applicable or not stated. |
| (e) Education; community (civic) and economic life; working for people aged five years or over. Excludes 38,147 service users whose support needs were not applicable or not stated. |
| AIHW 2005i |
For activities of daily living, 35% of Indigenous service users reported always needing help and a further 46% reported sometimes needing help. Nearly all Indigenous service users reported always or sometimes needing support with activities of independent living and activities of work, education and community living (91% and 93% respectively). Indigenous service users were more likely to report always needing help with, or being unable to do, activities of daily living (35%), independent living (42%) and work, education and community living (50%) than other service users (28%, 34% and 42% respectively).
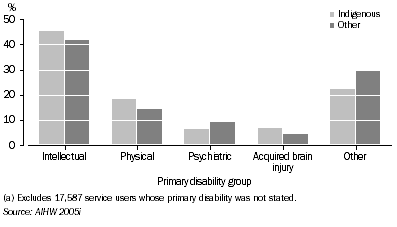
The most common primary disability group reported among Indigenous service users was intellectual disability (45% of Indigenous service users), followed by physical disability (19%), acquired brain injury (7%), and psychiatric disability (7%) (graph 11.11). Other primary disabilities included neurological, sensory and speech disabilities, specific learning/attention deficit disorder and autism. A higher proportion of Indigenous service users had an intellectual disability, physical disability or an acquired brain injury compared with other service users. Other service users were more likely to report one of the other disability groupings than Indigenous service users (30% compared with 22%).
11.11 Users of CSTDA-funded services(a), primary disability group by Indigenous status - 2003-04

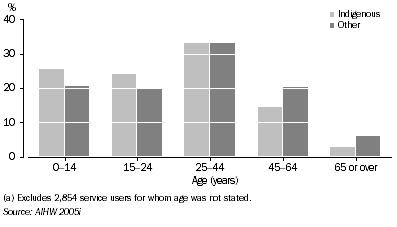
Indigenous service users of CSTDA services were younger, on average, than other service users (graph 11.12). Nearly one-quarter (24%) of Indigenous service users were aged 15-24 years, and 83% were aged under 45 years. The median age for Indigenous service users was 25 years compared with 31 years for other service users (AIHW 2005i). This may reflect the earlier onset of chronic health conditions and lower life expectancy in the Indigenous population (Chapter 9).
11.12 Users of CSTDA-funded services(a), by Indigenous status and age - 2003-04

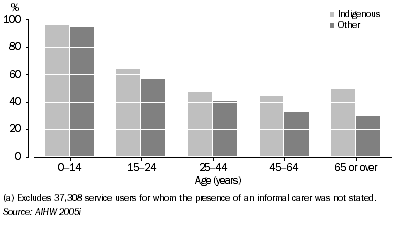
Considering valid (non-missing) responses only, Indigenous service users were more likely to report the presence of an informal carer than were other service users across all age groups (graph 11.13). The most marked difference was found in the oldest age group (65 years or over), where 50% of Indigenous service users reported having a carer, compared with 30% of other service users. A large difference was also found in the proportion of service users reporting the presence of a carer in the 45-64 year age group (44% of Indigenous service users compared to 32% of others). The relationship of a carer to service user varied somewhat between Indigenous and other service users. While mothers were by far the most common carer reported, they provided care to 58% of Indigenous service users compared to 69% of other service users. Indigenous service users were more likely to report ‘other female relative’ as their main carer (14%, compared to 4% for non-Indigenous) (AIHW 2005i). This is probably a reflection of the extended kinship patterns evident in many Aboriginal and Torres Strait Islander families that are different to mainstream care arrangements established around the nuclear family (Zubrick et al. 2004).
11.13 Users of CSTDA-funded services(a), presence of an informal carer by Indigenous status and age - 2003-04

 Print Page
 Print All