|
|
Links to ABS publications mentioned in the text can be found under 'Other Related Articles' at the bottom of the page.
RECORDED CRIME IN QUEENSLAND, 1995 TO 2001
In Queensland from 1995 to 2001 rates of most major categories of crime (assault, kidnapping/abduction, robbery, unlawful entry with intent, motor vehicle theft, and other theft) have generally been lower than for Australia. For the crime categories of homicide and related offences, sexual assault and blackmail/extortion, this is not the case.
This article provides recent statistics on crime in Queensland, information on various measurements of crime and links to further information on crime.
Property crime
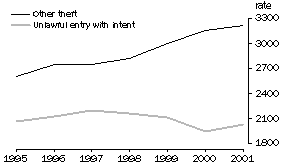
Unlawful entry with intent
The category of 'unlawful entry' is defined as the unlawful entry of a structure (either forced or unforced) with the intent to commit an offence such as theft, property damage, assault, etc. It includes burglary, break and enter and stealing. It excludes shop-stealing and stealing from a house or premise to which the offender has been invited or has legitimate access whereby the intent was unlawful but the entry was not. It also excludes trespass whereby entry is unlawful but there is no intent to commit an offence.
VICTIMISATION RATE(a) per 100,000 persons, Queensland
 Source: Recorded Crime, 2001 (cat. no. 4510.0)
(a) See the end of this article for further information
on this and other crime measurements.
Source: Recorded Crime, 2001 (cat. no. 4510.0)
(a) See the end of this article for further information
on this and other crime measurements.
The Queensland rate in 2001 was 2031.9 victims per 100,000 people which was lower than Western Australia, Northern Territory, New South Wales and South Australia and also lower than the rate for Australia (2246.9). The rate has fluctuated slightly since 1995 with a high of 2191.3 in 1997 and a low of 1953.8 in 2000.
Other theft
Police records show that the category of 'other theft' is the most common offence category. 'Other theft' is the taking of another person's property with the intention of depriving the owner of the property illegally and without permission, but without force, threat of force, use of coercive measures, deceit or having gained unlawful entry to any structure even if the intent was to commit theft.
This category includes theft of motor vehicle parts or contents, theft from a person and theft from retail premises. In Queensland the rate in 2001 was 3217.1 victims per 100,000 people, higher than Victoria and Tasmania only and lower than the Australian rate of 3607.5. The rate for Queensland has risen fairly steadily since 1955 when it was 2601.9.
Personal crime
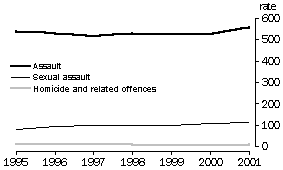
Homicide and related offences
The category of 'homicide and related offences' contains crimes which either did, or potentially could have, resulted in the death of the victim. This group of serious personal crimes represent only a small fraction of overall crime in Queensland. While the victimisation rate has fluctuated these crimes do not show any significant change since 1995. In 2001 Queensland had a higher rate of victimisation than Australia, for 3 out of the 4 categories of homicide and related offences, although differences were relatively small. The rate of homicide and related offences was 7.5 per 100,000 persons for Queensland and 5.4 per 100,000 persons for Australia.
VICTIMISATION RATE(a) per 100,000 persons, Queensland
 Source: Recorded Crime, 2001 (cat. no. 4510.0)
(a) See the end of this article for further information
on this and other crime measurements.
Source: Recorded Crime, 2001 (cat. no. 4510.0)
(a) See the end of this article for further information
on this and other crime measurements.
Assault
The most common personal crime recorded is assault, which is the direct infliction of force, injury or violence upon a person, including attempts or threats. Although the number of assaults recorded in Queensland shows an increase since 1995, the rate of assault per 100,000 persons has been relatively stable. In 2001, the assault victimisation rate for Queensland was 557.4 per 100,000 people, considerably less than the rate of 782.9 for Australia.
Sexual assault
Sexual assault is a less common recorded crime than assault. From 1995 to 2001 the rate of sexual assault relative to the population has trended upwards. The 2001 victimisation rate of sexual crime in Queensland was 110.8, compared to the Australian rate of 86.4 per 100,000 people.
VICTIMS(a) OF SELECTED OFFENCES RECORDED BY POLICE, Queensland |  |
|
| Offence category | 1995 | 1996 | 1997 | 1998 | 1999 | 2000 | 2001 |
|
NUMBER |
|
| Homicide and related offences | 238 | 240 | 248 | 267 | 233 | 248(b) | 271 |
| Murder | 63 | 65 | 75 | 64 | 64 | 78(b) | 65 |
| Attempted murder | 120 | 135 | 111 | 150 | 112 | 123(b) | 155 |
| Manslaughter | 9 | 9 | 11 | 10 | 14 | 7 | 15 |
| Driving causing death(a) | 46 | 31 | 51 | 43 | 43 | 40(b) | 36 |
| | | | | | | | |
| Assault | 17,694 | 17,659 | 17,646 | 18,329 | 18,425 | 18,707(b) | 20,220 |
| Sexual assault | 2,504 | 3,034 | 3,332 | 3,485 | 3,550 | 3,752(b) | 4,021 |
| Kidnapping/abduction | 74 | 71 | 108 | 98 | 93 | 95(b) | 76 |
| | | | | | | | |
| Robbery | 1,983 | 2,127 | 2,439 | 2,531 | 2,470 | 2,357(b) | 2,556 |
| Armed robbery | 892 | 909 | 1,251 | 1,285 | 1,257 | 1,198(b) | 1,172 |
| Unarmed robbery | 1,091 | 1,218 | 1,188 | 1,246 | 1,213 | 1,159(b) | 1,384 |
| | | | | | | | |
| Blackmail/extortion | 54 | 93 | 85 | 78 | 70 | 63(b) | 89 |
| | | | | | | | |
| Unlawful entry with intent | 67,544 | 70,847 | 74,439 | 74,592 | 74,189 | 69,689(b) | 73,713 |
| Property theft | 51,697 | 52,863 | 56,952 | 56,907 | 56,361 | 51,156(b) | 55,564 |
| Other | 15,847 | 17,984 | 17,487 | 17,685 | 17,828 | 18,533(b) | 18,149 |
| | | | | | | | |
| Motor vehicle theft | 18,416 | 17,274 | 17,058 | 15,693 | 18,249 | 18,623(b) | 17,466 |
| Other Theft | 84,954 | 92,025 | 93,390 | 97,384 | 105,169 | 112,319(b) | 116,712 |
|
RATE PER 100,000 POPULATION |
|
| Homicide and related offences | 7.3 | 7.2 | 7.3 | 7.7 | 6.6 | 7.0(b) | 7.5 |
| Murder | 1.9 | 1.9 | 2.2 | 1.9 | 1.8 | 2.2 | 1.8 |
| Attempted murder | 3.7 | 4.0 | 3.3 | 4.3 | 3.2 | 3.4 | 4.3 |
| Manslaughter | 0.3 | 0.3 | 0.3 | 0.3 | 0.4 | 0.2 | 0.4 |
| Driving causing death(a) | 1.4 | 0.9 | 1.5 | 1.2 | 1.2 | 1.1(b) | 1.0 |
| | | | | | | | |
| Assault | 541.9 | 528.9 | 519.4 | 530.7 | 525.4 | 524.5(b) | 557.4 |
| Sexual assault | 76.7 | 90.9 | 98.1 | 100.9 | 101.2 | 105.2(b) | 110.8 |
| Kidnapping/abduction | 2.3 | 2.1 | 3.2 | 2.8 | 2.7 | 2.7 | 2.1 |
| | | | | | | | |
| Robbery | 60.7 | 63.7 | 71.8 | 73.3 | 70.4 | 66.1(b) | 70.5 |
| Armed robbery | 27.3 | 27.2 | 36.8 | 37.2 | 35.8 | 33.6(b) | 32.3 |
| Unarmed robbery | 33.4 | 36.5 | 35.0 | 36.1 | 34.6 | 32.5(b) | 38.1 |
| | | | | | | | |
| Blackmail/extortion | 1.7 | 2.8 | 2.5 | 2.3 | 2.0 | 1.8 | 2.5 |
| | | | | | | | |
| Unlawful entry with intent | 2,068.7 | 2,122.0 | 2,191.3 | 2,159.9 | 2,115.5 | 1,953.8(b) | 2,031.9 |
| Property theft | 1,583.3 | 1,583.3 | 1,676.5 | 1,647.8 | 1,607.2 | 1,434.2(b) | 1,531.6 |
| Other | 485.3 | 538.7 | 514.8 | 512.1 | 508.4 | 519.6(b) | 500.3 |
| | | | | | | | |
| Motor vehicle theft | 564.0 | 517.4 | 502.1 | 454.4 | 520.4 | 522.1(b) | 481.4 |
| Other theft | 2,601.9 | 2,756.3 | 2,749.1 | 2,819.9 | 2,998.9 | 3,149.0(b) | 3,217.1 |
|
(a) Victims may refer to individual people, organisations robbed, places or premises entered, or motor vehicles stolen.
(b) Revised figures | |
| | | | | | | | |
Source: Recorded Crime, Australia (cat. no. 4510.0).
|
NOTES ON CRIME STATISTICS
Police administrative records provide data on offences that become known to the police and are recorded by them. Offences are classified into categories which can be divided into three basic groups. The groups are
- offences against a person
- offences against property
- offences against the state, community or organisations. (This category includes illicit drug offences and road traffic and motor vehicle offences.)
The ABS collates data from police services in all states and territories, and annually publishes summary information of offences against a person or property in Recorded Crime (cat. no. 4510.0). In recent years, reported offences against the person have only accounted for about 11 to 12% of all offences covered in that publication.
Detailed statistics on all categories of offences, including those not covered by Recorded Crime (cat. no. 4510.0), can be found in the Annual Statistical Reviews in the Reports & Publications Section of the Queensland Police Service web site.
The recorded crime victimisation rate is an indicator of the prevalence of a particular type of crime within any region. It is measured by taking the number of incidences recorded and dividing by the size of the population. The crime rate is usually expressed as a rate per 100,000 people.
When interpreting this data, it should be kept in mind that:
- Changes in recorded crime may reflect changes in the incidence of criminal behaviour, but may also reflect changes in community attitudes to reporting crime and changes in policing strategies and recording systems.
- Many crimes are not reported to the police, as evidenced in results from ABS household-based crime and safety surveys. The results from the 1998 National Crime and Safety Survey indicated that the reporting rate of personal crimes was lower than the reporting rate for property crimes. One of the known factors for this difference is the requirement to report property crimes for insurance purposes. In Australia, 78% of household victims of break-ins reported the most recent incident to police, but the reporting rate was only 28% for assault victims and 33% for sexual assault victims. More detailed information is contained in Crime and Safety, Australia (cat. no. 4509.0).
Click here for the most recent ABS crime and safety statistics, featured in the publication Crime and Safety Australia (cat. no. 4509.0).
Click here for the most recent ABS crime and safety statistics, featured in the publication Recorded Crime Australia (cat. no. 4510.0).
Click here to return to Social Characteristics of the Population.
|
 Print Page