INDUSTRIAL RELATIONS
Industrial relations can be regarded as the relationships and interactions in the labour market between employers and employees (and their representatives), and the intervention in these relations by governments, government agencies and tribunals (e.g. the Australian Fair Pay Commission and the Australian Industrial Relations Commission).
Historically, governments have regulated the Australian labour market to varying degrees. Changes to the structure or processes underpinning the industrial relations environment have generally followed changes in governments, and periods of social or economic change. For most of the last century, employee-employer relationships were shaped by highly centralised Commonwealth and state tribunal-based systems of conciliation and arbitration. However, since the late-1980s, the industrial relations environment in Australia has undergone significant change and is now characterised by more decentralised arrangements.
The field of industrial relations is complex and diverse and, for statistical purposes, is not easily measured. The ABS collects information on a number of topics to provide an insight into the state of the industrial relations environment, including the methods used for setting pay (i.e. awards, collective agreements and individual arrangements), industrial disputes, and trade union membership.
How pay is set
Information on the methods of setting the main part of employees' pay is collected in the EEH survey. Three different methods of setting pay are identified - awards, collective agreements, and individual arrangements.
Awards are legally enforceable determinations made by federal or state industrial tribunals that set the terms of employment (pay and conditions). Awards usually cover a particular industry or occupation. Employees whose pay is set by 'award only' are those who have their pay set by an award, and who are not paid more than the award rate of pay.
Collective agreements, which include enterprise and workplace agreements, are agreements between an employer (or group of employers) and a group of employees (or one or more unions or employee associations representing employees). Collective agreements set the terms of employment, and are usually registered with an industrial tribunal or authority.
Individual arrangements are arrangements between an employer and an individual employee on the terms of employment for the employee. Employees whose pay is set by an individual arrangement include those whose pay is set by an individual contract, registered individual agreement (e.g. an Australian Workplace Agreement), or common law contract, as well as employees receiving over-award payments by individual agreement, and working proprietors of incorporated businesses.
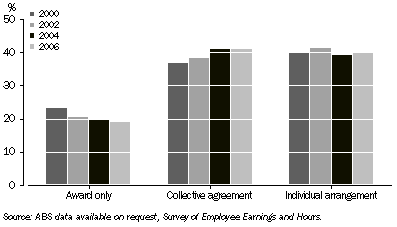
Graph 8.55 shows the proportion of employees who had their pay set by award only decreased from 23% in May 2000 to 19% in May 2006. Over the same period the proportion of employees who had their pay set by a collective agreement increased from 37% to 41%.
8.55 Methods of setting pay - May
In May 2006, 39% of all private sector employees had their pay set through an unregistered individual arrangement, compared with only 3% of public sector employees (table 8.56). Most public sector employees had their pay set by a registered collective agreement (93%). Men were more likely than women to have their pay set by an unregistered individual arrangement (37% compared with 27%), and less likely than women to have their pay set by award only (15% compared with 23%). Part of the difference between male and female employees' pay setting methods can be attributed to the differing proportions of men and women in the various occupation and industry groups.
8.56 METHODS OF SETTING PAY - May 2006 |
|  |
| | Collective agreement | Individual arrangement | |
| Award only | Registered | Unregistered | Registered | Unregistered(a) | Working proprietor of incorporated business(a) | |
| Sector | % | % | % | % | % | % | |
MALES | |
| |
| Private | 17.4 | 23.2 | 3.9 | 3.9 | 43.1 | 8.6 | |
| Public | *1.4 | 92.4 | 0.2 | 2.4 | 3.6 | . . | |
| All sectors | 14.7 | 34.6 | 3.3 | 3.6 | 36.6 | 7.2 | |
FEMALES | |
| |
| Private | 29.7 | 25.8 | 3.6 | 2.7 | 34.4 | 3.8 | |
| Public | *3.1 | 93.2 | **0.2 | 1.6 | 1.8 | . . | |
| All sectors | 23.4 | 41.7 | 2.8 | 2.5 | 26.7 | 2.9 | |
PERSONS | |
| |
| Private | 23.1 | 24.4 | 3.8 | 3.3 | 39.0 | 6.3 | |
| Public | *2.4 | 92.9 | *0.2 | 2.0 | 2.6 | . . | |
| All sectors | 19.0 | 38.1 | 3.0 | 3.1 | 31.7 | 5.1 | |
| |
| * estimate has a relative standard error of 25% to 50% and should be used with caution |
| ** estimate has a relative standard error greater than 50% and is considered too unreliable for general use |
| . . not applicable |
| (a) Prior to 2004, working proprietors of incorporated businesses were classified to unregistered individual arrangements. |
| Source: Employee Earnings and Hours, Australia (6306.0). |
As shown in table 8.57, the occupation groups which had the highest proportion of employees who had their pay set by a registered or unregistered individual arrangement were Managers and administrators and Advanced clerical and service workers (54% and 49% respectively). A further 21% of Managers and administrators were working proprietors of their own incorporated business. Awards were far more prevalent in the lower skilled occupations, with 38% of Elementary clerical, sales and service workers and 30% of Labourers and related workers having their pay set by award only. In contrast, only 2% of Managers and administrators and 7% of Professionals had their pay set by award only. Collective agreements were most prevalent for Professionals (57%) and Intermediate production and transport workers (47%).
8.57 METHODS OF SETTING PAY, By occupation(a) - May 2006 |
| |
| | | Individual arrangement | |
| Award only | Collective agreement(b) | Registered or unregistered(c) | Working proprietor of incorporated business(c) | |
| % | % | % | % | |
| |
| Managers and administrators | 1.9 | 23.0 | 53.6 | 21.5 | |
| Professionals | 7.1 | 56.9 | 31.7 | 4.3 | |
| Associate professionals | 7.6 | 38.3 | 43.4 | 10.7 | |
| Tradespersons and related workers | 21.4 | 31.1 | 40.3 | 7.1 | |
| Advanced clerical and service workers | 10.7 | 30.8 | 49.0 | 9.5 | |
| Intermediate clerical, sales and service workers | 26.1 | 36.4 | 36.4 | 1.2 | |
| Intermediate production and transport workers | 16.3 | 46.5 | 34.0 | 3.2 | |
| Elementary clerical, sales and service workers | 37.8 | 44.0 | 17.4 | 0.8 | |
| Labourers and related workers | 30.5 | 41.4 | 26.8 | *1.4 | |
| All occupations | 19.0 | 41.2 | 34.8 | 5.1 | |
| |
| * estimate has a relative standard error of 25% to 50% and should be used with caution |
| (a) Classified according to the Australian Standard Classification of Occupations (ASCO), Second Edition, 1997. |
| (b) Includes registered and unregistered agreements. |
| (c) Prior to 2004, working proprietors of incorporated businesses were classified to unregistered individual arrangements. |
| Source: Employee Earnings and Hours, Australia (6306.0). |
The Accommodation, cafes and restaurants, and Retail trade industries had the highest proportion of employees who had their pay set by award only (57% and 29% respectively) (table 8.58). Collective agreements were more prevalent in Government administration and defence (92%), Electricity, gas and water supply (84%) and Education (81%). The industries with the highest proportion of employees who had their pay set through a registered or unregistered individual arrangement were Wholesale trade (71%), Mining (67%) and Property and business services (52%).
8.58 METHODS OF SETTING PAY, By industry(a) - May 2006 |
| |
| | | Individual arrangement | |
| Award only | Collective agreement(b) | Registered or unregistered(c) | Working proprietor of incorporated business(c) | |
| % | % | % | % | |
| |
| Mining | *2.4 | 29.8 | 66.7 | *1.1 | |
| Manufacturing | 10.6 | 37.7 | 47.4 | 4.3 | |
| Electricity, gas and water supply | *0.9 | 84.4 | 14.4 | *0.3 | |
| Construction | 12.0 | 27.7 | 43.5 | 16.8 | |
| Wholesale trade | 12.8 | 9.5 | 71.1 | 6.6 | |
| Retail trade | 28.7 | 34.8 | 32.1 | 4.4 | |
| Accommodation, cafes and restaurants | 57.2 | 8.8 | 30.6 | 3.5 | |
| Transport and storage | 12.4 | 40.4 | 40.9 | 6.3 | |
| Communication services | **0.9 | 61.3 | 30.7 | 7.1 | |
| Finance and insurance | 5.1 | 42.6 | 45.8 | 6.4 | |
| Property and business services | 23.2 | 15.5 | 52.4 | 8.9 | |
| Government administration and defence | *0.6 | 91.8 | 7.6 | . . | |
| Education | 11.9 | 81.5 | 6.5 | *0.2 | |
| Health and community services | 25.4 | 58.4 | 14.0 | 2.2 | |
| Cultural and recreational services | 19.2 | 40.7 | 37.2 | *2.9 | |
| Personal and other services | 23.4 | 46.4 | 36.8 | 3.4 | |
| All industries | 19.0 | 41.2 | 34.8 | 5.1 | |
| |
| * estimate has a relative standard error of 25% to 50% and should be used with caution |
| ** estimate has a relative standard error greater than 50% and is considered too unreliable for general use |
| . . not applicable |
| (a) Classified according to the Australian and New Zealand Standard Industrial Classification (ANZSIC), 1993 edition. |
| (b) Includes registered and unregistered agreements. |
| (c) Prior to 2004, working proprietors of incorporated businesses were classified to unregistered individual arrangements. |
| Source: Employee Earnings and Hours, Australia (6306.0). |
8.59 Industrial disputes
Industrial disputes
The ABS defines an industrial dispute as a disagreement over an issue or group of issues between an employer and its employees, which results in employees ceasing work. Industrial disputes comprise: strikes, which are a withdrawal from work by a group of employees; and lockouts, which are a refusal by an employer or group of employers to permit some or all of their employees to work.
8.60 INDUSTRIAL DISPUTES, Selected indicators |
| |
| Disputes | Employees involved | Working days lost | Working days lost per dispute | |
| no. | ’000 | ’000 | no. | |
| |
| 2002 | 767 | 159.7 | 259.0 | 338 | |
| 2003 | 643 | 275.6 | 439.4 | 683 | |
| 2004 | 692 | 194.0 | 379.8 | 549 | |
| 2005 | 472 | 241.0 | 228.3 | 484 | |
| 2006 | 202 | 122.7 | 132.6 | 656 | |
| |
| Source: ABS data available on request, Industrial Disputes collection. |
This section presents statistics on industrial disputes involving work stoppages of ten or more working days lost. Working days lost refers to working days lost by employees directly and indirectly involved in the dispute. Directly involved employees are those who actually participated in the dispute. Indirectly involved employees are those who were stood down at the location where the stoppage occurred, but who were not themselves parties to the dispute.
8.61 WORKING DAYS LOST PER THOUSAND EMPLOYEES, By selected industries(a) |
| |
| | 2002 | 2003 | 2004 | 2005 | 2006 | |
| | no. | no. | no. | no. | no. | |
| |
| Mining | | | | | | |
| Coal | 361.8 | 375.1 | 294.5 | 500.1 | 97.1 | |
| Other | 19.6 | 330.1 | 117.5 | 27.2 | 13.5 | |
| Manufacturing | | | | | | |
| Metal products; Machinery and equipment | 92.2 | 214.9 | 71.7 | 103.7 | 102.1 | |
| Other | 82.7 | 59.6 | 34.1 | 27.7 | 12.9 | |
| Construction | 224.6 | 248.6 | 223.7 | 153.8 | 24.0 | |
| Transport and storage; Communication services | 54.2 | 53.7 | 37.9 | 20.0 | 15.8 | |
| Education; Health and community services | 3.1 | 76.1 | 81.8 | 28.9 | 29.2 | |
| Other industries(b) | 8.7 | 4.9 | 10.0 | 2.2 | 1.7 | |
| All industries | 32.5 | 53.7 | 45.5 | 26.4 | 14.9 | |
| |
| (a) Classified according to the Australian and New Zealand Standard Industrial Classification (ANZSIC), 1993 edition. |
| (b) Includes: Agriculture, forestry and fishing; Electricity, gas and water supply; Wholesale trade; Retail trade; Accommodation, cafes and restaurants; Finance and insurance; Property and business services; Government administration and defence; Cultural and recreational services; and Personal and other services. |
| Source: ABS data available on request, Industrial Disputes collection. |
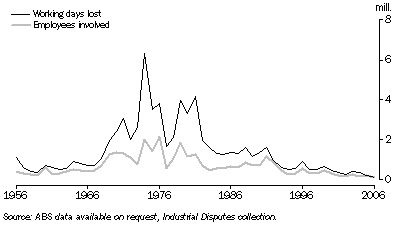
Graph 8.59 shows the number of working days lost per year, and the number of employees involved, have fluctuated from year to year, but have decreased significantly over the last two decades.
There were 132,600 working days lost due to industrial disputes in 2006, a decrease of 42% from 2005 (table 8.60). There were also less disputes in 2006 than in 2005 (202 compared with 472). However, the average number of working days lost per dispute increased (from 484 to 656). From 2005 to 2006, the number of employees involved in industrial disputes decreased by 49% from 241,000 to 122,700.
Table 8.61 shows that from 2005 to 2006, the number of working days lost per thousand employees decreased from 26 to 15. All industries recorded decreases between 2005 and 2006, except for Education, Health and community services which recorded a slight increase. The Coal mining industry recorded the largest decrease between 2005 and 2006 (from 500 to 97), followed by the Construction industry (from 154 to 24) and Other manufacturing (from 28 to 13).
Trade union membership
A trade union is defined as an organisation, consisting predominantly of employees, whose principal activities include the negotiation of rates of pay and conditions of employment for its members. In August 2006 there were 1.8 million employees who were trade union members in their main job, a 7% decrease on the number recorded in August 2005. The proportion of employees who were trade union members also decreased between August 2005 and August 2006 (from 22.4% to 20.3%). Table 8.62 shows in 2006 the public sector had a higher proportion of employees with trade union membership, compared with the private sector (43% and 15% respectively). A slightly higher proportion of men than women were trade union members (21% compared with 19%).
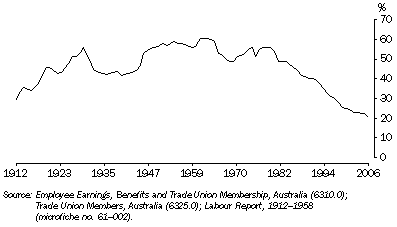
Graph 8.63 shows that in Australia the rate of trade union membership peaked at 61% in 1962, before declining rapidly between 1962 and 1970. This period was followed by increasing membership during the 1970s. Since then the proportion of employees who were trade union members has steadily declined.
8.63 Trade union membership, proportion of employees who were trade union members
Some of the factors contributing to the decline in trade union membership include the changing workplace relations environment and the changing industry composition of the work force, for example, the emergence of industries that are not highly unionised such as Property and business services. Another factor in the decline in trade union membership is the increase in part-time and casual employment. These types of employment have historically been less unionised than full-time employment.
Graph 8.64 shows the level of trade union membership varies considerably across industries, with the Electricity, gas and water supply (43%), Education (40%), Government administration and defence (34%), and Transport and storage (29%) industries being the most unionised in 2006. The least unionised industries were Property and business services (5%), Agriculture, forestry and fishing (6%), Wholesale trade and Accommodation, cafes and restaurants (both 8%).
Between 2001 and 2006 most industries experienced a drop in their rate of unionisation. The largest declines occurred in industries that were highly unionised in 2001, with the proportion of employees who were trade union members falling in the Communication services industry (from 39% in 2001 to 25% in 2006), Transport and storage (from 39% to 29%) and Finance and insurance (from 22% to 13%).
8.64 Employees who were trade union members, by industry(a)

 Print Page