 Quality Declaration
Page tools:
 Print Page Print Page
 Print All Print All
| ||||||||||||||||||||||
|
SUMMARY OF FINDINGS PERSONS IN CORRECTIVE SERVICES The Corrective Services, Australia publication presents data for two different populations; persons in full-time custody and persons in community-based corrections. These populations cannot be compared directly. However, they are presented together to provide an overview of persons in corrective services. For the community-based corrections order types, offenders may be counted more than once if they have two or more different types of community-based corrections orders operating simultaneously.
PERSONS IN CUSTODY In the June quarter 2018, the average daily number of full-time prisoners in Australia was 42,855. This was an increase of:
Since the March quarter 2018, there were increases in the prisoner numbers for all states and territories with exception of South Australia where prisoners decreased by 1% (37 persons). The Australian Capital Territory had the largest percentage increase with 5% (24 persons). (Table 1) In the last five years (from June quarter 2013 to June quarter 2018), the number of persons in custody has increased by 39% (12,043 persons). (Table 1 and historical data)
, Jun 2013 to Jun 2018.GIF) Footnote(s): (a) Based on average daily number Source(s): Corrective Services, Australia In the June quarter 2018, the largest contributors to the national prisoner population were:
Sex The average daily number of females and males in custody both increased since the June quarter 2017, with females increasing at a higher percentage (8% or 268 persons) than males (4% or 1382 persons). (Table 1) Over a longer time period (the past five years), the number of males in custody increased by 38% (10,745 persons) and the number of females in custody increased by 55% (1,297 persons). (Table 1 and historical data) For the June quarter 2018, the average daily imprisonment rate for males was 414 persons per 100,000 adult male population, which was more than 11 times the rate for females (37 female persons per 100,000 adult female population). (Table 5) Type of full-time custody Prisoners can be housed in either:
During the June quarter 2018, 81% of prisoners in full-time custody were held in secure custody and the remaining 19% in open custody, representing an average daily number of 34,566 and 8,289 persons respectively. Since the June quarter 2017, the secure custody prisoner population increased by 6% (1,865 persons) and the open custody prisoner population decreased by 3% (214 persons). (Table 6) Legal status Legal status refers to where a person may be either sentenced or unsentenced depending on the warrant(s) or court order(s) that provide the legal basis for the administration of the person through the criminal justice system. In the June quarter 2018, the average number of full-time prisoners on the first day of the month was 42,878, of which:
, Jun 2013 to Jun 2018.GIF) Footnote(s): (a) Based on average number on the first day of the month Source(s): Corrective Service, Australia Federal prisoners Federal prisoners are persons charged and sentenced under a Commonwealth statute or transferred from another country to serve their sentence in Australia. During the June quarter 2018, the average daily number of federal sentenced prisoners in Australia was 963, a decrease of 4% (44 persons) from the March quarter 2018. (Table 10) Rates per 100,000 adult population Nationally, the average daily imprisonment rate for the June quarter 2018 was 222 per 100,000 adult population, increasing from 219 per 100,000 adult population in the March quarter 2018. The Northern Territory continued to have the highest imprisonment rate of all states and territories with 965 persons per 100,000 adult population, increasing from 958 per 100,000 adult population in the March quarter 2018. Western Australia had the next highest imprisonment rate with 347 persons per 100,000 adult population, increasing from 342 per 100,000 adult population in the March quarter 2018. Tasmania had the lowest average daily imprisonment rate (149 persons per 100,000 adult population). (Table 3)
, By states and territories, Jun 2017 and Jun 2018.GIF) Footnote(s): (a) Rate is the number of prisoners per 100,000 adult population. Based on average daily number. Source(s): Corrective Services, Australia Aboriginal and Torres Strait Islander prisoners The average daily number of Aboriginal and Torres Strait Islander prisoners during the June quarter 2018 was 11,963 persons. This represented an increase of 1% (146 persons) over the quarter and an increase of 5% (552 persons) over the year. (Table 1) Based on first day of the month figures, there were 12,005 Aboriginal and Torres Strait Islander prisoners in the June quarter 2018, of which 66% (7,866 persons) were sentenced and 34% (4,107 persons) were unsentenced. (Table 13) Aboriginal and Torres Strait Islander prisoners represented 28% of the total full-time adult prisoner population during the June quarter 2018, whilst accounting for approximately 2% of the total Aboriginal and Torres Strait Islander Australian population aged 18 years and over (Estimates and Projections, Aboriginal and Torres Strait Islander Australians, 2001 to 2026 (cat. no. 3238.0)). (Table 1) Three states continue to account for nearly three-quarters of the total Aboriginal and Torres Strait Islander prisoner population: New South Wales (29% or 3,418 persons); Queensland (23% or 2,792 persons); and Western Australia (23% or 2,707 persons). (Table 1) The national average daily Aboriginal and Torres Strait Islander imprisonment rate was 2,505 persons per 100,000 adult Aboriginal and Torres Strait Islander population. The highest Aboriginal and Torres Strait Islander imprisonment rates were recorded in:
, By states and territories, Jun 2017, Mar 2018 and Jun 2018.GIF) Footnote(s): (a) Rate is the number of prisoners per 100,000 adult Aboriginal and Torres Strait Islander population. Based on average daily number. Source(s): Corrective Services, Australia Since the June quarter 2017, South Australia, Tasmania and Queensland had decreases in their Aboriginal and Torres Strait Islander imprisonment rate. The largest annual decrease was in South Australia, 7% or 187 persons per 100,000 adult Aboriginal and Torres Strait Islander population. The largest annual increase was in the Australian Capital Territory with 13% (262 persons per 100,000 adult Aboriginal and Torres Strait Islander population). (Table 12) PERSONS IN COMMUNITY-BASED CORRECTIONS Reported daily averages for number of persons serving community-based corrections orders are based on first day of the month figures. For more information, please refer to the Explanatory Notes, paragraphs 2 and 12. Community-based corrections orders are non-custodial orders served under the authority of adult corrective services agencies and include restricted movement, reparations (fine option and community service), supervision orders (parole, bail, sentenced probation) and post-sentence supervision orders. Number of persons in community-based corrections The average daily number of persons serving community-based corrections orders in the June quarter 2018 was 69,397 persons, representing;
, Jun 2013 to Jun 2018.GIF) Footnote(s): (a) Based on average number on the first day of the month Source(s): Corrective Services, Australia Three states accounted for over three-quarters of the national number of persons in community-based corrections:
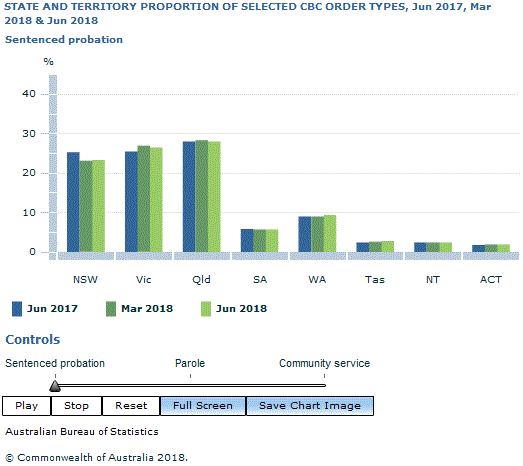
Over the past five years (since the June quarter 2013), persons serving community-based corrections orders increased by 28% or 15,365 persons. (Table 1 and historical data) Sex In the June quarter 2018, males accounted for 81% (55,867 persons) of the total persons serving community based correction orders, and the remaining one-fifth were female (13,514 persons). Over the past five years (since June quarter 2013), females serving community-based correction orders have increased at a higher rate than males, increasing by 40% (3,858 persons) compared to males by 26% (11,512 persons). (Table 1 and historical data) Type of orders A person may be serving more than one type of CBC order at the same time. Therefore, the total count of orders may be greater than the total count of persons serving CBC orders. For more information, please refer to the Explanatory Notes, paragraph 15. In the June quarter 2018, there were a total of 74,114 CBC orders. The three most prevalent order types in Australia were:
There were increases since the March quarter 2018 for:
There were decreases since the March quarter 2018 for:
 Source(s): Corrective Services, Australia Rates per 100,000 adult population In the June quarter 2018, the daily average national rate of persons in community-based corrections was 360 persons per 100,000 adult population, representing an increase of less than 1% (1 person per 100,000) from the March quarter 2018 and for the year. (Table 16)
, By states and territories, Jun 2017, Mar 2018 and Jun 2018.GIF) Footnote(s): (a) Rate is the number of persons serving community-based corrections orders. Based on average number on the first day of the month, per 100,000 adult population Source(s): Corrective Services, Australia Aboriginal and Torres Strait Islander persons in community-based corrections Nationally, the average daily number of Aboriginal and Torres Strait Islander persons in community-based corrections for the June quarter 2018 was 14,512, representing an increase of 1% (198 persons) from the March quarter 2018 and an increase of 5% (710 persons) for the year. Aboriginal and Torres Strait Islander persons make up just over one fifth (21%) of the total community-based corrections population, of which just over three-quarters were located within three states: Queensland (33% or 4,718 persons); New South Wales (32% or 4,590 persons); and Western Australia (12% or 1,748 persons). (Table 18) , Jun 2016 to Jun 2018.GIF) Footnote(s): (a) Based on average number on the first day of the month Source(s): Corrective Services, Australia PRISONER RECEPTIONS A reception refers to the entry into full-time adult corrective services custody from the community. In the June quarter 2018, there were 16,760 prisoner receptions in Australia. Prisoner receptions decreased by 3% (540 persons) from March quarter 2018 and increased by 5% (828 persons) for the year. (Tables 20) The majority of prisoner receptions in the June quarter 2018 were male (85% (14,315 persons) and the remaining 15% were female (2,436 persons). (Table 20) Unsentenced prisoner receptions accounted for three quarters (12,558 persons) of the 16,760 prisoner reception. The remaining quarter (4,202 persons) were sentenced. (Table 21) There were 5,339 Aboriginal and Torres Strait Islander prisoner receptions in the June quarter 2018, a decrease of 9% (507 persons) since the March quarter 2018 and an increase of 6% (323 persons) for the year. In the June quarter 2018, Aboriginal and Torres Strait Islander prisoner receptions represented 32% of the overall prisoner receptions population. (Tables 20) Document Selection These documents will be presented in a new window.
|
|||||||||||||||||||||
