JUNE KEY FIGURES
 | Jun Qtr 2005 | Mar Qtr 2006 | Jun Qtr 2006 | |
| CONSOLIDATED ASSETS | $m | $m | $m | |
| |
| Superannuation funds | 445 002 | 535 283 | 544 710 | |
| Life insurance offices(a) | 191 353 | 205 340 | 203 736 | |
| Other managed funds | 233 190 | 270 463 | 279 069 | |
| Total | 869 545 | 1 011 085 | 1 027 515 | |
| |
| (a) Investments by superannuation funds which are held and administered by life insurance offices are included under life insurance offices. |
| See note on consolidation in Explanatory Notes, paragraph 10. |
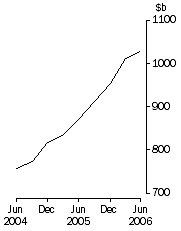
Total consolidated assets
| |
JUNE KEY POINTS
CONSOLIDATED ASSETS
- Total consolidated assets of managed funds institutions was $1027.5b at 30 June 2006, an increase of $16.4b (1.6%) on the revised March quarter 2006 figure of $1011.1b.
- Consolidated assets of superannuation funds increased by $9.4b (1.8%), public unit trusts by $7.0b (3.2%) and cash management trusts by $1.3b (3.6%). Partially offsetting these increases was a decrease in the consolidated assets of life insurance offices by $1.6b (-0.8%).
- Investment in cash and deposits increased by $8.2b (12.5%), land and buildings, up $6.0b (5.4%), long term securities, up $3.7b (4.6%), loans and placements, up $2.4b (11.0%), and assets overseas, up $2.1b (0.9%). Investment in short term securities fell by $7.7b (-8.9%).
- Investment in equities and units in trust increased marginally by $0.5b (0.1%). This reflected decreases in asset values during the June quarter 2006. The S&P/ASX 200 fell 1.1%, the price of foreign shares (represented by the US S&P 500) fell 1.9%, and the $A appreciated against the $US by 3.8%. Domestic bond prices rose during the quarter with the 5 year Treasury Bond yield increasing from 5.31% to 5.72%.
- Investment managers had $972.8b in funds under management at 30 June 2006, up $3.8b (0.4%) on the revised March quarter 2006 figure of $969.0b. They managed $689.7b (67.1%) of the consolidated assets of managed funds institutions.
NOTES
FORTHCOMING ISSUES
| ISSUE (QUARTER) | Release Date |
| September 2006 | 24 November 2006 |
| December 2006 | 30 March 2007 |
REVISIONS THIS ISSUE
There have been revisions in some series as a result of quality assurance work undertaken with data providers.
SIGNIFICANT EVENTS
There are no significant events in this issue.
ROUNDING
Discrepancies may occur between sums of the component items and totals due to rounding.
INQUIRIES
For further information about these and related statistics, contact the National Information and Referral Service on 1300 135 070 or Sawbhag Naidu on Canberra (02) 6252 5386.
ANALYSIS
CONSOLIDATED ASSETS
By type of institution
At 30 June 2006, consolidated assets of superannuation funds were $544.7b, up $9.4b (1.8%) on the revised March 2006 figure. Consolidated assets of public unit trusts increased by $7.0b (3.2%) and cash management trusts by $1.3b (3.6%). Consolidated assets of life insurance offices decreased by $1.6b (-0.8%). Assets of common funds and friendly societies have increased marginally on the March quarter figures.
By type of asset
The major asset movements for the quarter were cash and deposits, up $8.2b (12.5%), short-term securities, down $7.7b (-8.9%), land and buildings, up $6.0b (5.4%), long term securities, up $3.7b (4.6%), loans and placements, up $2.4b (11.0%), assets overseas, up $2.1b (0.9%), and other assets, up $1.2b (4.1%).
Cross investment
The table below presents the unconsolidated, cross-invested and consolidated assets of managed funds by type of fund as at 30 June 2006.
| Unconsolidated assets | Cross- invested assets | Consolidated assets | |
| Type of fund | $m | $m | $m | |
| |
| Life insurance offices | 238 278 | 34 543 | 203 736 | |
| Superannuation funds | 716 391 | 171 680 | 544 710 | |
| Public unit trusts | 260 176 | 34 120 | 226 056 | |
| Friendly societies | 6 735 | 2 136 | 4 599 | |
| Common funds | 10 687 | 454 | 10 234 | |
| Cash management trusts | 38 181 | - | 38 181 | |
| Total | 1 270 448 | 242 933 | 1 027 515 | |
| |
| - nil or rounded to zero (including null cells) |
UNCONSOLIDATED ASSETS
Life insurance offices
At 30 June 2006, the total assets of life insurance offices were $238.3b, a decrease of $1.5b (-0.7%) on the revised March 2006 figure of $239.8b. Major decreases were recorded in equities and units in trusts of $2.2b (-1.4%), short term securities of $0.6b (-4.9%) and other financial assets of $0.4b (-14.0%). Partially offsetting this was an increase in long term securities of $1.4b (5.7%).
Superannuation funds
The total assets of superannuation funds held outside of life offices was $716.4b at 30 June 2006, an increase of $13.3b (1.9%) on the revised March 2006 quarter figure. Major increases were recorded for equities and units in trusts of $5.8b (1.7%), cash and deposits of $5.7b (9.9%), other financial assets of $2.1b (20.0%), assets overseas of $1.8b (1.2%) and land and buildings $1.1b (3.1%), Major decreases were recorded for short term securities of $2.9b (-8.4%) and long term securities of $0.6b (-1.2%).
Public unit trusts
The total assets for public unit trusts was $260.2b at 30 June 2006, up $7.0b (2.7%) on the revised March 2006 figure of $253.2b. The major increases were in land and buildings, up $4.5b (6.5%) and loans and placements, up $2.0b (30.5%). Other non-financial assets decreased by $1.2b (-9.6%) and short term securities decreased by $0.6b (-9.9%).
Friendly societies
Total assets of friendly societies was $6.7b at 30 June 2006, virtually unchanged from the March 2006 figure. There was an increase in cash and deposits, up $0.4b (62.0%), which was offset by a decrease in short term securities of $0.4b (-32.3%).
Common funds
Total assets of common funds was $10.7b at 30 June 2006, up $0.3b (2.7%) on the March 2006 figure of $10.4b. There was an increase in cash and deposits, of $0.2b (11.9%) and a decrease in short term securities of $0.1b (-2.3%).
Cash management trusts
Total assets of cash management trusts was $38.2b at 30 June 2006, up $1.3b (3.6%) on the March 2006 figure of $36.9b. Major increases were in long term securities of $2.6b (107.5%) and cash and deposits of $1.8b (47.5%). This was partially offset by a decrease in short term securities of $3.1b (-10.9%).
INVESTMENT MANAGERS
Source of funds under management
During the June quarter 2006, there was an increase in total funds under management by investment managers of $3.8b (0.4%), bringing the total funds under management to $972.8b.
The value of funds under management on behalf of superannuation funds increased by $2.8b (0.7%) and cash management trusts increased by $1.2b (4.1%). This was partially offset by a decrease in the value of funds under management on behalf of life insurance offices of $1.3b (-0.9%).
During the quarter, the value of funds under management on behalf of sources other than managed funds increased $1.1b (0.4%). Of this, the largest increases were in funds under management on behalf of other trusts, up $2.4b (1.9%) and government, up $1.5b (6.4%). These were partially offset by a decrease in funds under management on behalf of other investment managers, down $2.9b (-10.3%), and general insurance, down $0.7b (-2.3%).
The value of funds under management on behalf of overseas sources remained virtually unchanged ($40.5b) on the March 2006 quarter figure.
The value of managed funds assets invested through investment managers was $689.7b at 30 June 2006, representing 67.1% of the consolidated assets of managed funds.
 Print Page
 Print All