INTRODUCTION
This publication presents summary statistics of expenditure and human resources devoted to research and experimental development (R&D) carried out in Australia by organisations within the Business, Government and Private non-profit sectors during 2002-03 and the Higher education sector during the 2002 calendar year.
The statistics presented in this publication have previously been published (at a more detailed level) on an individual sector basis (see paragraph 14 of the Explanatory Notes).
RESEARCH AND EXPERIMENTAL DEVELOPMENT (R&D) GUIDELINES
Australian Bureau of Statistics (ABS) surveys of R&D are conducted in accordance with standard guidelines promulgated by the Organisation for Economic Co-operation and Development (OECD). It should be noted that R&D performed overseas by Australian organisations is included in the data in this publication. The extent to which this impacts on international comparisons is being investigated.
REVISIONS
It should be noted that data presented in this publication may subsequently be revised. These revisions are generally small and do not impact significantly on the period to period movements. Where revisions have been applied, the estimate is annotated with an 'r'.
INQUIRIES
For further information about these and related statistics, contact the National Information and Referral Service on 1300 135 070 or Derek Byars on Canberra (02) 6252 5627.
MAIN FEATURES
EXPENDITURE ON R&D
Gross expenditure on R&D (GERD) in Australia in 2002-03 was estimated to be $12,250m at current prices, 17.6% higher than that recorded in 2000-01. With the exception of the state/territory government which remained steady, all sectors showed an increase in R&D expenditure compared with 2000-01.
EXPENDITURE ON R&D
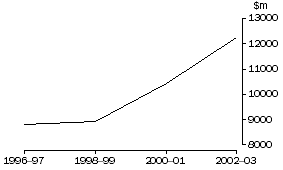
GROSS EXPENDITURE ON R&D |
|  |
| | 1996-97 | 1998-99 | 2000-01 | 2002-03 | |
| Sector | $m | $m | $m | $m | |
| |
| Business | 4,234.7 | r4,094.7 | r4,982.6 | 5,978.6 | |
| Government | | | | | |
| Commonwealth | 1,266.6 | r1,179.4 | r1,404.8 | 1,531.3 | |
| State/territory | 797.7 | r863.6 | r951.0 | 950.9 | |
| Higher education | 2,307.6 | 2,555.1 | r2,789.8 | 3,429.6 | |
| Private non-profit | 185.8 | r225.3 | r289.0 | 359.5 | |
| Total | 8,792.4 | r8,918.1 | r10,417.1 | 12,249.9 | |
| |
| r revised |
In 2002-03, the sectors accounted for the following proportions of GERD:
- Business 48.8%
- Higher education 28.0%
- Government 20.3%
- Private non-profit 2.9%.
By comparison, in 2000-01, the sectors had the following proportions:
- Business 47.8%
- Higher education 26.8%
- Government 22.6%
- Private non-profit 2.8%.
GERD AS A PERCENTAGE OF GDP
GERD as a percentage of GDP has risen from 1.55% in 2000-01 to 1.62% in 2002-03.
GERD AS A PERCENTAGE OF GDP
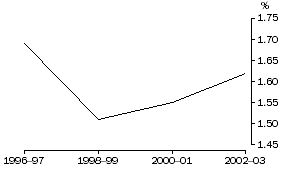
Australia's GERD/GDP ratio is low compared with other OECD countries. Australia is ranked below countries such as Finland, Japan, United States of America, Germany and France. Australia's overall ranking reflects the low R&D expenditure to GDP ratio of the Business sector, despite the Government and Higher education sectors having comparatively high ratios.
GERD/GDP RATIOS OF OECD COUNTRIES |
| |
| 2000-01 | 2002-03 | |
| Country | % | % | |
| |
| Finland | 3.40 | 3.46 | |
| Japan | 2.99 | 3.12 | |
| Iceland | 2.75 | 3.09 | |
| Korea | 2.65 | 2.91 | |
| United States of America | 2.72 | 2.67 | |
| Germany | 2.49 | 2.52 | |
| Denmark | na | 2.52 | |
| France | 2.18 | 2.20 | |
| Austria | 1.86 | 1.93 | |
| Canada | 1.92 | 1.91 | |
| United Kingdom | 1.84 | 1.88 | |
| Norway | na | 1.67 | |
| Australia | 1.55 | 1.62 | |
| Czech Republic | 1.33 | 1.30 | |
| Spain | 0.94 | 1.03 | |
| Hungary | 0.80 | 1.02 | |
| Portugal | 0.80 | 0.93 | |
| Poland | 0.66 | 0.59 | |
| Slovak Republic | 0.65 | 0.58 | |
| |
| na not available |
HUMAN RESOURCES DEVOTED TO R&D
In 2002-03, 104,252 person years were devoted to R&D, up 9.0% from 2000-01. The majority of human resources devoted to R&D were by Higher education organisations (47.6%), Businesses (31.6%) and Government organisations (17.8%). In the period 1996-97 to 2002-03, human resources devoted to R&D increased by 15.0% or 13,560 person years. Over this period, person years of human resources devoted to R&D increased steadily in the Higher education and Private non-profit sectors. In the Business sector, human resources fell between 1996-97 and 1998-99 and then increased in 2000-01 and again in 2002-03. In the Government sector, human resources fell between 1996-97 and 2000-01 and then increased in 2002-03.
HUMAN RESOURCES DEVOTED TO R&D |
| |
| | 1996-97 | 1998-99 | 2000-01 | 2002-03 | |
| Sector | person years | person years | person years | person years | |
| |
| Business | 26,412 | r25,109 | r28,391 | 32,982 | |
| Government | | | | | |
| Commonwealth | 10,377 | r9,353 | r9,565 | 10,185 | |
| State/territory | 8,813 | r9,069 | r8,587 | 8,357 | |
| Higher education | 42,739 | 45,502 | 46,287 | 49,612 | |
| Private non-profit | 2,351 | r2,551 | r2,791 | 3,117 | |
| Total | 90,692 | r91,583 | r95,621 | 104,252 | |
| |
| r revised |
TYPE OF EXPENDITURE
Current expenditure accounted for 91.6% of gross R&D expenditure, with capital expenditure accounting for the remaining 8.4%. Labour costs accounted for 45.1% of total expenditure.
Other current expenditure was the main component (48.4%) of total R&D expenditure by the Business sector, up from 47.2% in 2000-01. Labour costs accounted for 43.9% of Business R&D expenditure, the same as in 2000-01.
Labour costs continued to be the main component of Government R&D expenditure (51.9%), up from 50.6% in 2000-01. Capital expenditure accounted for 8.8%, down from 9.0% in 2000-01.
Current expenditure accounted for 91.0%, down from 92.3% in 2000-01, of Higher education R&D expenditure. Labour costs accounted for 41.9% of total Higher education R&D expenditure in 2002-03.
SOURCE OF FUNDS
The major sources of funds for R&D expenditure in Australia in 2002-03 were Business 46.4% ($5,688m), up slightly from 46.3% in 2000-01, and Commonwealth government 37.6% ($4,612m). State/territory/local government as a source of funds provided 6.7% in 2002-03, down from 7.8% in 2000-01. Other Australian sources provided 4.9% in 2002-03, up from 4.7% in 2000-01 while Overseas provided 4.3% of funds in 2002-03, up from 3.5% in 2000-01.
TYPE OF ACTIVITY
Experimental development remained the predominant activity for GERD, accounting for 38.6% ($4,727m) although this proportion was down from 39.5% in 2000-01. The proportions of GERD on the other activities were:
- Applied research 35.7% ($4,379m), up from 34.7% in 2000-01
- Strategic basic research 15.5% ($1,904m), virtually unchanged from 15.6% in 2000-01
- Pure basic research 10.1% ($1,240m), virtually unchanged from 10.2% in 2000-01.
In 2002-03, the Higher education sector accounted for 78.6% ($975m) of expenditure on Pure basic research and 42.2% ($803m) of expenditure on Strategic basic research and was the main contributor to each of these activities. The Business sector accounted for 35.2% ($1,540m) of expenditure on Applied research and 85.5% ($4,040m) of expenditure on Experimental development activity and was the main contributor to each of these activities.
LOCATION OF EXPENDITURE
The leading states in terms of location of gross R&D expenditure in 2002-03 were New South Wales with $3,745m and Victoria with $3,547m, accounting for 30.6% and 29.0% respectively.
EXPENDITURE BY SOCIOECONOMIC OBJECTIVE
In 2002-03, 63.1% ($7,726m) of R&D expenditure was directed towards Economic development. Society accounted for a further 20.7% of R&D expenditure, followed by Environment (6.5%), Non-oriented research (6.4%) and Defence (3.3%). Manufacturing accounted for 38.6% ($2,981m) of R&D expenditure directed towards Economic development.
The majority of expenditure on R&D by the Business sector was on Economic development (90.0%) and by the Commonwealth government sector with 54.6% and by the State/territory government sector with 53.1%.
The main purpose of R&D expenditure in the Higher education and the Private non-profit sectors was Society, 43.0% and 96.2% respectively.
EXPENDITURE BY RESEARCH FIELD
The bulk of the Business sector's R&D expenditure was in Engineering and technology (54.4%) and Information, computing and communication sciences (24.1%).
The research fields in which most Commonwealth government expenditure on R&D occurred were Engineering and technology (25.7%), Agricultural, veterinary and environmental sciences (15.9%), Earth sciences (13.3%) and Information, computing and communication sciences (10.8%).
State/territory government R&D expenditure was mainly in Agricultural, veterinary and environmental sciences (54.5%), Medical and health sciences (18.1%) and Biological sciences (10.7%).
The research fields in which significant Higher education R&D expenditure occurred were Other research fields (27.4%), primarily the Social sciences and Humanities, Medical and health sciences (25.2%), Biological sciences (12.0%) and Engineering and technology (10.9%).
The majority of the Private non-profit sector's R&D expenditure was in Medical and health sciences (61.4%) and Biological sciences (29.1%).
TYPE OF EMPLOYEE
Total person years of effort for 2002-03 for R&D was 104,252, an increase of 8,631 person years on 2000-01. The effort by Researchers increased by 8.5% from 66,002 to 71,613 person years. R&D effort by Technicians and Other supporting staff increased by 10.2% from 29,619 to 32,639 person years.
Researchers were the predominant type of employee in total person years for all sectors, other than the Commonwealth government, accounting for 86.2% of Higher education person years, 57.3% of Business person years, 51.4% of State/territory government person years and 61.1% of Private non-profit person years of effort.
HUMAN RESOURCES BY SOCIOECONOMIC OBJECTIVE
Of the total person years on R&D, Economic development accounted for 51.2% and Society for 29.2%. These proportions are noticeably different to those for expenditure reflecting the fact that average R&D expenditure per person year of effort differs across the sectors. In particular, it is considerably lower for the Higher education sector because a major part of the R&D is carried out by postgraduates and the research is generally directed towards more labour intensive objectives.
HUMAN RESOURCES BY RESEARCH FIELD
The bulk of the Business sector's human resource effort was in Engineering and technology (51.2%) and Information, computing and communication sciences (29.3%).
The main research fields that the Commonwealth government sector's human resource effort was directed towards included Engineering and technology (27.9%) and Agricultural, veterinary and environmental sciences (16.9%).
State/territory government human resource effort was predominantly expended in Agricultural, veterinary and environmental sciences (49.4%) and Medical and health sciences (24.3%).
The research fields in which Higher education human resource efforts were mainly expended were Other research fields (39.0%), primarily the Social sciences and Humanities, Medical and health sciences (19.0%), Engineering and technology (10.4%) and Biological sciences (9.6%).
The majority of the Private non-profit sector's human resource effort was directed towards Medical and health sciences (62.4%) and Biological sciences (31.0%).
 Print Page
 Print All