December Key Figures
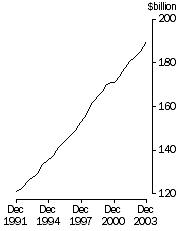
GDP—Trend, Chain Volume Measure

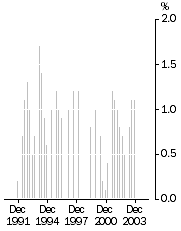
| GDP—Trend, Chain Volume Measure, qtly change

|
December Key Points
Trend estimates
- In volume terms GDP increased by 1.1% in the December quarter. GDP per capita grew by 0.8%, GDP per hour worked in the market sector grew by 1.6% and real net national disposable income grew by 1.6%.
Seasonally adjusted estimates
- In volume terms GDP increased by 1.4% in the December quarter. Non-farm GDP rose by 1.0% while farm GDP rose by 13.3%. Strong growth in the terms of trade is being reflected in very strong growth in real net national disposable income of 2.0% in the December quarter and 5.1% since December quarter 2002.
- On the expenditure side the increase in GDP was driven by growth in household final consumption expenditure (+1.0 percentage points) and private business investment (+0.5 percentage points). These were offset by negative contributions from net exports (-0.5 percentage points) and total inventories (-0.5 percentage points).
- On the production side there were notable positive contributions from agriculture, forestry and fishing (0.4 percentage points), construction (0.3 percentage points) and transport and storage (0.2 percentage points).
Notes
Revisions
Revisions have been made to a number of aggregates. Their net effect on the September quarter 2003 estimate of seasonally adjusted GDP (in chain volume terms) has been to increase quarterly growth by 0.1 percentage points. A detailed summary of the revisions is presented in the Analysis and Comments section on page 15.
NATIONAL ACCOUNTS QUARTERLY PRESENTATIONS
The National Accounts Branch runs a series of presentations in each ABS state and territory office following the release of the quarterly national accounts. The presentations cover movements in GDP and its components and specific state detail.
For more information, including contact details, please refer to the National Accounts theme page on the ABS web site .
Quarterly Public Finance Release
The first issue of Government Finance Statistics, Quarterly Australia (cat. no. 5519.0.55.001) is scheduled for release on 17 March 2004. It will be released electronically on the ABS web site. Further information is available from Fleming Gilfelt on (02) 6252 7501.
Inquiries
For further information contact Michael Anderson on Canberra 02 6252 6713 for income & consumption estimates, and Patricia Mahony on Canberra 02 6252 6711 for investment, trade & industry estimates.
 Print Page
 Print All