MARCH KEY FIGURES
 | | Dec Qtr 2015 to Mar Qtr 2016 | Mar Qtr 2015 to Mar Qtr 2016 |
| Weighted average of eight capital cities | % change | % change |
|
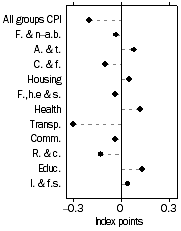
| All groups CPI | -0.2 | 1.3 |
| Food and non-alcoholic beverages | -0.2 | 0.0 |
| Alcohol and tobacco | 0.9 | 6.1 |
| Clothing and footwear | -2.6 | -0.8 |
| Housing | 0.3 | 1.7 |
| Furnishings, household equipment and services | -0.4 | 2.0 |
| Health | 1.9 | 4.6 |
| Transport | -2.5 | -0.5 |
| Communication | -1.5 | -6.4 |
| Recreation and culture | -1.0 | 0.1 |
| Education | 3.1 | 3.3 |
| Insurance and financial services | 0.6 | 2.3 |
| CPI analytical series | | |
| All groups CPI, seasonally adjusted | -0.1 | 1.3 |
| Trimmed mean | 0.2 | 1.7 |
| Weighted median | 0.1 | 1.4 |
|
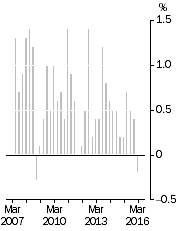
All Groups CPI, Quarterly change
| Contribution to quarterly change
|
MARCH KEY POINTS
THE ALL GROUPS CPI
- fell 0.2% this quarter, compared with a rise of 0.4% last quarter.
- rose 1.3% over the twelve months to the March quarter 2016, compared with a rise of 1.7% over the twelve months to the December quarter 2015.
OVERVIEW OF CPI MOVEMENTS
- The most significant price falls this quarter are automotive fuel (-10.0%), fruit (-11.1%) and international holiday travel and accommodation (-2.0%).
- The most significant offsetting price rises this quarter are secondary education (+4.6%), medical and hospital services (+1.6%) and pharmaceutical products (+4.8%).
NOTES
FORTHCOMING ISSUES
| ISSUE (QUARTER) | Release Date |
| June 2016 | 27 July 2016 |
| September 2016 | 26 October 2016 |
| December 2016 | 25 January 2017 |
| March 2017 | 26 April 2017 |
CHANGES IN THIS ISSUE
None this issue.
ROUNDING
Any discrepancies between totals and sums of components in this publication are due to rounding.
INQUIRIES
For further information about these and related statistics, contact the National Information and Referral Service on 1300 135 070.
 Quality Declaration
  Print Page
 Print All