SEPTEMBER KEY FIGURES
| WEIGHTED AVERAGE OF EIGHT CAPITAL CITIES | Jun Qtr 2009 to Sep Qtr 2009 % change | Sep Qtr 2008 to Sep Qtr 2009 % change |
|
| Food | -1.1 | 2.1 |
| Alcohol and tobacco | 0.5 | 4.3 |
| Clothing and footwear | 0.5 | 2.2 |
| Housing | 3.8 | 7.6 |
| Household contents and services | 0.7 | 4.1 |
| Health | -2.1 | 4.4 |
| Transportation | 2.7 | -7.1 |
| Communication | 0.1 | 1.1 |
| Recreation | 0.9 | 0.9 |
| Education | 0.1 | 5.6 |
| Financial and insurance services | 1.9 | -6.4 |
| All groups | 1.0 | 1.9 |
|
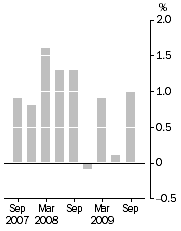
PBLCI - All Groups, Quarterly change
| PBLCI - All Groups, Contribution to quarterly change - September quarter 2009
|
SEPTEMBER KEY POINTS
THE ALL GROUPS PENSIONER AND BENEFICIARY LIVING COST INDEX (PBLCI)
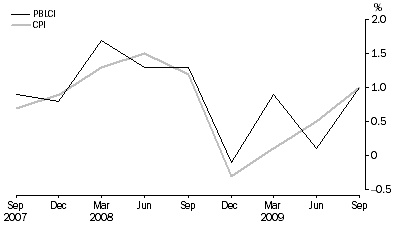
- rose 1.0% for the September quarter 2009, compared with a rise of 0.1% in the June quarter 2009.
- showed the same increase for the September quarter 2009 as the CPI (+1.0%).
- rose 1.9% through the year to September quarter 2009, compared to an annual rise of 2.3% to June quarter 2009.
- showed a larger increase through the year to September quarter 2009 than the CPI (+1.3%).
OVERVIEW OF PBLCI MOVEMENTS
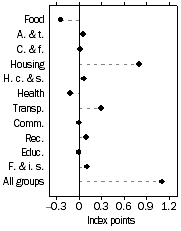
- The most significant price rises this quarter were for housing (+3.8%) and transportation (+2.7%).
- The most significant offsetting price falls this quarter were for food (-1.1%) and health (-2.1%).
NOTES
FORTHCOMING ISSUES
| ISSUE (QUARTER) | Release Date |
| December 2009 | 15 February 2010 |
| March 2010 | 17 May 2010 |
| June 2010 | 16 August 2010 |
| September 2010 | 15 November 2010 |
ROUNDING
Any discrepancies between totals and sums of components in this publication are due to rounding.
INDEX NUMBERS USE REFERENCE BASE OF JUNE QUARTER 2007 = 100.0
To allow comparison of the Pensioner and Beneficiary Living Cost Index with other ABS price indexes, all index numbers in this publication use a reference base of June quarter 2007 = 100.0. However, percentage changes used in this publication for the Consumer Price Index are as published in
Consumer Price Index, Australia (cat. no. 6401.0). The percentage changes for Analytical Living Cost Indexes used in this publication are as published in
Analytical Living Cost Indexes for Selected Australian Household Types (cat. no. 6463.0).
INQUIRIES
For further information about these and related statistics, contact the National Information and Referral Service on 1300 135 070 or Lee Taylor on Canberra (02) 6252 6251, email <lee.taylor@abs.gov.au>.
SUMMARY COMMENTARY
THE PENSIONER AND BENEFICIARY LIVING COST INDEX
The Pensioner and Beneficiary Living Cost Index (PBLCI) has been designed to answer the question:
'By how much would after tax money incomes need to change to allow age pensioners and other households whose principal source of income is government benefits to purchase the same quantity of consumer goods and services that they purchased in the base period?'
The PBLCI has been derived by combining the age pensioner Analytical Living Cost Index (ALCI) and the other government transfer recipient ALCI. Living cost indexes are intended to measure the impact of changes in prices on the out-of-pocket expenses incurred by these particular household types.
In the September quarter 2009 the PBLCI increased by 1.0%. The Consumer Price Index (CPI) rose by 1.0% over the same period.
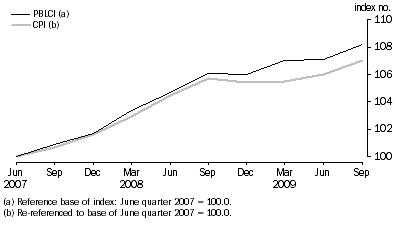
Since the PBLCI series began in June quarter 2007 it has risen 8.2%, compared to 7.0% for the CPI. Differences have occurred for a number of reasons that relate to factors that affect the component series used to compile the PBLCI. The inclusion of mortgage interest and consumer credit charges and the different treatments of housing and insurance in the PBLCI result in variations between the PBLCI and the CPI series. The expenditure patterns of age pensioner and other government transfer recipient households differ from those of the overall household sector covered by the CPI. This also contributes to differences in the percentage changes.
For more information on the relationship between the PBLCI, CPI and the ALCIs, see the Explanatory Notes.
MAIN CONTRIBUTORS TO CHANGE
The PBLCI increased 1.0% for the September quarter 2009. Housing (+3.8%) made the greatest contribution to the quarterly rise due to increases in electricity, water and sewerage. Transportation (+2.7%) also saw increases for the quarter as a result of rises in automotive fuel.
The most significant offsets were provided by food (-1.1%) and health (-2.1%) due to falls in fruit and vegetable prices and pharmaceuticals respectively.
The PBLCI showed the same increase as the CPI (+1.0% in each case) for the quarter. PBLCI households have a higher proportion of expenditure attributed to utilities, which recorded strong rises in the September quarter. Falls for fruit and vegetable prices, for which PBLCI households also have a relatively higher proportion of expenditure, offset the impact of the strong rises for utilities resulting in similar movements for all groups PBLCI and CPI.
The PBLCI increased 1.9% for the year to September quarter 2009. Housing (+7.6%) and food (+2.1%) made the greatest contributions to the annual rise. Offsets were provided by transportation (-7.1%) and financial and insurance services (-6.4%).
GRAPHS
Pensioner and Beneficiary Living Cost Index and CPI, All groups
- Percentage change (from previous quarter)
Pensioner and Beneficiary Living Cost Index and CPI (re-referenced), index numbers
Comparison of PBLCI and analytical living cost indexes
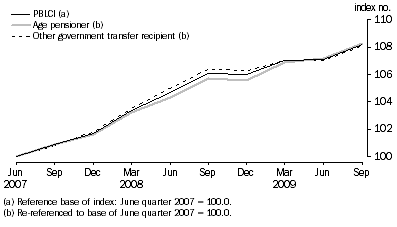
Table 1: Pensioner Beneficiary Cost Living Index, All Groups, Weighted average of eight capital cities - index numbers, percentage change and points change |
|
 | | | Percentage Change | Points change |
| Quarters | Index Numbers(a) | From previous quarter | From corresponding quarter of previous year | From previous quarter | From corresponding quarter of previous year |
|
| 2007 | | | | | |
| September | 100.9 | 0.9 | . . | 0.9 | . . |
| December | 101.7 | 0.8 | . . | 0.8 | . . |
| 2008 | | | | | |
| March | 103.4 | 1.6 | . . | 1.7 | . . |
| June | 104.7 | 1.3 | 4.7 | 1.3 | 4.7 |
| September | 106.1 | 1.3 | 5.2 | 1.4 | 5.2 |
| December | 106.0 | -0.1 | 4.2 | -0.1 | 4.3 |
| 2009 | | | | | |
| March | 107.0 | 0.9 | 3.5 | 1.0 | 3.6 |
| June | 107.1 | 0.1 | 2.3 | 0.1 | 2.4 |
| September | 108.2 | 1.0 | 1.9 | 1.1 | 2.1 |
|
| . . not applicable |
| (a) Reference base of index: June quarter 2007 = 100.0. |
Table 2: Percentage change in analytical living cost indexes, PBLCI and CPI, Commodity group - June quarter 2009 to September quarter 2009 |
|
| Commodity group | Age pensioner | Other government transfer recipient | PBLCI | CPI |
|
| Food | -1.2 | -0.9 | -1.1 | -0.8 |
| Alcohol and tobacco | 0.8 | 0.5 | 0.5 | 0.7 |
| Clothing and footwear | 0.6 | 0.5 | 0.5 | 0.3 |
| Housing(a) | 4.4 | 3.4 | 3.8 | 2.9 |
| Household contents and services | 0.7 | 0.6 | 0.7 | 0.6 |
| Health | -2.0 | -2.2 | -2.1 | -1.0 |
| Transportation | 2.5 | 2.7 | 2.7 | 1.9 |
| Communication | 0.2 | 0.1 | 0.1 | 0.0 |
| Recreation | 0.8 | 0.9 | 0.9 | 0.7 |
| Education | 0.1 | 0.1 | 0.1 | 0.0 |
| Financial and insurance services(b) | 2.4 | 1.5 | 1.9 | 0.9 |
| All groups | 1.1 | 1.0 | 1.0 | 1.0 |
|
| (a) House purchases are included in the CPI but excluded from the other indexes. |
| (b) Includes interest charges and general insurance, except for the CPI. Interest charges are excluded from the CPI and general insurance is calculated on a different basis. |
Table 3: Points contribution to quarterly change, June quarter 2009 to September quarter 2009 - index points |
|
| Commodity group | Age pensioner ALCI(a) | Other government transfer recipient ALCI(a) | PBLCI(b) | CPI(a) |
|
| Food | -0.29 | -0.20 | -0.24 | -0.13 |
| Alcohol and tobacco | 0.06 | 0.05 | 0.06 | 0.05 |
| Clothing and footwear | 0.03 | 0.03 | 0.02 | 0.01 |
| Housing(c) | 0.85 | 0.75 | 0.80 | 0.64 |
| Household contents and services | 0.08 | 0.06 | 0.07 | 0.05 |
| Health | -0.16 | -0.08 | -0.11 | -0.05 |
| Transportation | 0.29 | 0.30 | 0.30 | 0.26 |
| Communication | 0.01 | 0.00 | 0.01 | 0.00 |
| Recreation | 0.09 | 0.09 | 0.09 | 0.08 |
| Education | 0.00 | 0.00 | 0.00 | 0.00 |
| Financial and insurance services(d) | 0.13 | 0.09 | 0.11 | 0.09 |
| All groups | 1.1 | 1.1 | 1.1 | 1.0 |
|
| (a) Re-referenced to base of June quarter 2007 = 100.0. |
| (b) Reference base of index: June quarter 2007 = 100.0. |
| (c) House purchases are included in the CPI but excluded from the other indexes. |
| (d) Includes interest charges and general insurance, except for the CPI. Interest charges are excluded from the CPI and general insurance is calculated on a different basis. |
Table 4: Contribution to total index, Commodity group - June quarter 2009 to September quarter 2009 - index points |
|
| Age pensioner ALCI(a) | Other government transfer recipient ALCI(a) | PBLCI(b) | CPI(a) |
| Commodity group | Jun qtr 2009 | Sep qtr 2009 | Jun qtr 2009 | Sep qtr 2009 | Jun qtr 2009 | Sep qtr 2009 | Jun qtr 2009 | Sep qtr 2009 |
|
| Food | 23.68 | 23.39 | 21.27 | 21.07 | 22.29 | 22.05 | 17.51 | 17.38 |
| Alcohol and tobacco | 7.79 | 7.85 | 11.05 | 11.10 | 9.68 | 9.74 | 7.50 | 7.55 |
| Clothing and footwear | 4.79 | 4.82 | 4.54 | 4.57 | 4.65 | 4.67 | 3.74 | 3.75 |
| Housing(c) | 19.28 | 20.13 | 22.29 | 23.04 | 21.02 | 21.82 | 21.99 | 22.63 |
| Household contents and services | 11.29 | 11.37 | 10.36 | 10.42 | 10.75 | 10.82 | 9.54 | 9.59 |
| Health | 8.13 | 7.97 | 3.52 | 3.44 | 5.46 | 5.35 | 5.31 | 5.26 |
| Transportation | 11.65 | 11.94 | 11.18 | 11.48 | 11.38 | 11.68 | 13.38 | 13.64 |
| Communication | 3.72 | 3.73 | 4.36 | 4.36 | 4.09 | 4.10 | 3.17 | 3.17 |
| Recreation | 11.19 | 11.28 | 9.83 | 9.92 | 10.40 | 10.49 | 11.41 | 11.49 |
| Education | 0.17 | 0.17 | 2.04 | 2.04 | 1.26 | 1.26 | 3.11 | 3.11 |
| Financial and insurance services(d) | 5.51 | 5.64 | 6.52 | 6.61 | 6.09 | 6.20 | 9.33 | 9.42 |
| All groups | 107.2 | 108.3 | 107.0 | 108.1 | 107.1 | 108.2 | 106.0 | 107.0 |
|
| (a) Re-referenced to base of June quarter 2007 = 100.0. |
| (b) Reference base of index: June quarter 2007 = 100.0. |
| (c) House purchases are included in the CPI but excluded from the other indexes. |
| (d) Includes interest charges and general insurance, except for the CPI. Interest charges are excluded from the CPI and general insurance is calculated on a different basis. |
Table 5: Percentage change in analytical living cost indexes, PBLCI and CPI, Commodity group, September quarter 2008 to September quarter 2009 |
|
| Commodity group | Age pensioner | Other government transfer recipient | PBLCI | CPI |
|
| Food | 2.0 | 2.2 | 2.1 | 2.5 |
| Alcohol and tobacco | 4.1 | 4.4 | 4.3 | 4.0 |
| Clothing and footwear | 2.1 | 2.3 | 2.2 | 2.3 |
| Housing(a) | 7.8 | 7.5 | 7.6 | 5.5 |
| Household contents and services | 3.9 | 4.2 | 4.1 | 4.0 |
| Health | 4.5 | 4.2 | 4.4 | 4.4 |
| Transportation | -6.6 | -7.4 | -7.1 | -5.1 |
| Communication | 1.2 | 1.0 | 1.1 | 1.0 |
| Recreation | 0.6 | 1.2 | 0.9 | 0.1 |
| Education | 5.6 | 5.6 | 5.6 | 5.6 |
| Financial and insurance services(b) | 3.7 | -11.7 | -6.4 | -7.2 |
| All groups | 2.4 | 1.6 | 1.9 | 1.3 |
|
| (a) House purchases are included in the CPI but excluded from the other indexes. |
| (b) Includes interest charges and general insurance, except for the CPI. Interest charges are excluded from the CPI and general insurance is calculated on a different basis. |
Table 6: Points contribution to annual change, September quarter 2008 to September quarter 2009 - index points |
|
| Commodity group | Age pensioner ALCI(a) | Other government transfer recipient ALCI(a) | PBLCI(b) | CPI(a) |
|
| Food | 0.46 | 0.46 | 0.47 | 0.43 |
| Alcohol and tobacco | 0.30 | 0.47 | 0.41 | 0.29 |
| Clothing and footwear | 0.09 | 0.11 | 0.10 | 0.09 |
| Housing(c) | 1.45 | 1.62 | 1.55 | 1.18 |
| Household contents and services | 0.43 | 0.42 | 0.42 | 0.37 |
| Health | 0.34 | 0.14 | 0.22 | 0.22 |
| Transportation | -0.84 | -0.93 | -0.88 | -0.73 |
| Communication | 0.05 | 0.04 | 0.05 | 0.03 |
| Recreation | 0.07 | 0.12 | 0.10 | 0.01 |
| Education | 0.00 | 0.10 | 0.07 | 0.16 |
| Financial and insurance services(d) | 0.20 | -0.87 | -0.43 | -0.74 |
| All groups | 2.6 | 1.7 | 2.1 | 1.3 |
|
| (a) Re-referenced to base of June quarter 2007 = 100.0. |
| (b) Reference base of index: June quarter 2007 = 100.0. |
| (c) House purchases are included in the CPI but excluded from the other indexes. |
| (d) Includes interest charges and general insurance, except for the CPI. Interest charges are excluded from the CPI and general insurance is calculated on a different basis. |
Table 7: Contributions to total index, Commodity group, September quarter 2008 to September quarter 2009 - index points |
|
| Age pensioner ALCI(a) | Other government transfer recipient ALCI(a) | PBLCI(b) | CPI(b) |
| Commodity group | Sep qtr 2008 | Sep qtr 2009 | Sep qtr 2008 | Sep qtr 2009 | Sep qtr 2008 | Sep qtr 2009 | Sep qtr 2008 | Sep qtr 2009 |
|
| Food | 22.93 | 23.39 | 20.61 | 21.07 | 21.58 | 22.05 | 16.95 | 17.38 |
| Alcohol and tobacco | 7.55 | 7.85 | 10.63 | 11.10 | 9.33 | 9.74 | 7.26 | 7.55 |
| Clothing and footwear | 4.73 | 4.82 | 4.46 | 4.57 | 4.57 | 4.67 | 3.66 | 3.75 |
| Housing(c) | 18.68 | 20.13 | 21.42 | 23.04 | 20.27 | 21.82 | 21.45 | 22.63 |
| Household contents and services | 10.94 | 11.37 | 10.00 | 10.42 | 10.40 | 10.82 | 9.22 | 9.59 |
| Health | 7.63 | 7.97 | 3.30 | 3.44 | 5.13 | 5.35 | 5.04 | 5.26 |
| Transportation | 12.78 | 11.94 | 12.41 | 11.48 | 12.56 | 11.68 | 14.37 | 13.64 |
| Communication | 3.68 | 3.73 | 4.32 | 4.36 | 4.05 | 4.10 | 3.14 | 3.17 |
| Recreation | 11.21 | 11.28 | 9.80 | 9.92 | 10.39 | 10.49 | 11.48 | 11.49 |
| Education | 0.17 | 0.17 | 1.94 | 2.04 | 1.19 | 1.26 | 2.95 | 3.11 |
| Financial and insurance services(d) | 5.44 | 5.64 | 7.48 | 6.61 | 6.63 | 6.20 | 10.16 | 9.42 |
| All groups | 105.7 | 108.3 | 106.4 | 108.1 | 106.1 | 108.2 | 105.7 | 107.0 |
|
| (a) Re-referenced to base of June quarter 2007 = 100.0. |
| (b) Reference base of index: June quarter 2007 = 100.0. |
| (c) House purchases are included in the CPI but excluded from the other indexes. |
| (d) Includes interest charges and general insurance, except for the CPI. Interest charges are excluded from the CPI and general insurance is calculated on a different basis. |
 Print Page
 Print All