February Key Figures
 |
 |  | Jan 2004 | Feb 2004 | Jan 04 to Feb 04 | Feb 03 to Feb 04 |  |
|  |
| Trend |  |  |  |  |  |  |  |
 | Employed persons ('000) | 9,571.6 | 9,580.9 | 9.3 |  | 1.2 | % |  |
 | Unemployed persons ('000) | 584.4 | 585.8 | 1.4 |  | -6.4 | % |  |
 | Unemployment rate (%) | 5.8 | 5.8 | 0.0 | pts | -0.4 | pts |  |
 | Participation rate (%) | 63.5 | 63.5 | 0.0 | pts | -0.5 | pts |  |
| Seasonally Adjusted |  |  |  |  |  |  |  |
 | Employed persons ('000) | 9,571.4 | 9,572.7 | 1.3 |  | 0.9 | % |  |
 | Unemployed persons ('000) | 584.3 | 595.4 | 11.1 |  | -3.6 | % |  |
 | Unemployment rate (%) | 5.8 | 5.9 | 0.1 | pts | -0.3 | pts |  |
 | Participation rate (%) | 63.5 | 63.5 | 0.0 | pts | -0.6 | pts |  |
|  |
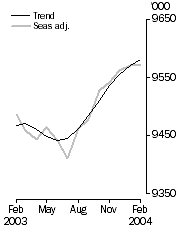
Employed Persons

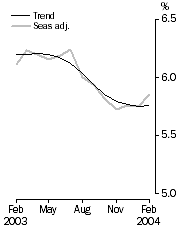
| Unemployment rate

|
February Key Points
TREND ESTIMATES (Monthly Change)
- EMPLOYMENT increased to 9,580,900.
- UNEMPLOYMENT increased to 585,800.
- UNEMPLOYMENT RATE remained at 5.8%.
- PARTICIPATION RATE remained at 63.5%.
SEASONALLY ADJUSTED ESTIMATES (Monthly Change)
EMPLOYMENT
- increased by 1,300 to 9,572,700. Full-time employment decreased by 13,100 to 6,848,300 and part-time employment increased by 14,400 to 2,724,500.
UNEMPLOYMENT
- increased by 11,100 to 595,400. The number of persons looking for full-time work increased by 5,700 to 431,200 and the number of persons looking for part-time work increased by 5,400 to 164,200.
UNEMPLOYMENT RATE
- increased by 0.1 percentage point to 5.9%. The male unemployment rate increased by 0.1 percentage point to 5.6% and the female rate increased by 0.1 percentage point to 6.2%.
PARTICIPATION RATE
Notes
CHANGES THIS MONTH
Estimates for prior periods have been revised using updated population benchmarks based on results from the 2001 Census of Population and Housing, and incorporating a minor change to the definition of unemployed persons. See page 3 for more details.
CAI IMPLEMENTATION
In October 2003, the ABS began the progressive implementation of computer assisted interviewing (CAI) into the LFS. Under CAI, interviewers record responses directly onto an electronic questionnaire in a laptop computer.
For the period October 2003 to January 2004 the CAI method was used on a random 10% sub-sample of survey interviews. The remaining 90% of interviews each month were conducted using the traditional 'pen and paper' method.
The ABS had planned to increase the sub-sample of survey interviews conducted using the CAI method from 10% to 40% in February 2004. However, a number of technical problems has prevented this. The CAI sub-sample was increased from 10% to 40% in February 2004 in New South Wales, Victoria, South Australia and the Australian Capital Territory only. Nationally this represents an increase in CAI interviews from 10% to about 28%. The effects of these technical problems may delay the full implementation of CAI.
The change in the interviewing method is not expected to affect published estimates in any meaningful way. Nonetheless, the ABS is monitoring the situation carefully and has conducted a range of analyses on each month's data. These analyses have confirmed that any effect that the change in interview method may have had on survey responses to date has not materially affected the aggregate estimates for any month.
Subject to further analysis continuing to confirm that the change in method is not having a significant impact on survey estimates, the ABS intends to progressively increase the use of CAI. Users will continue to be informed of the progress of CAI implementation, including the results of further analyses, through updates in this publication.
Inquiries
For further information about these and related statistics, contact the National Information and Referral Service on 1300 135 070 or Michael Johnson on Canberra (02) 6252 6525.
Changes This Month
Introduction
LFS estimates of persons employed, unemployed and not in the labour force are calculated in such a way as to add up to independent estimates of the civilian population aged 15 years and over (population benchmarks). These population benchmarks are updated every five years following the Census of Population and Housing. From February 2004, LFS estimates are being compiled using revised population benchmarks based on results from the 2001 census. LFS estimates for the period January 1999 to January 2004 have been revised based on the updated population benchmarks.
At the same time, the ABS has taken the opportunity to make several other changes to detailed original data at the unit record level. These changes include:
- introduction of regional population benchmarks
- revision of historical unit record data for definitional changes introduced in April 2001
- implementation of a minor change to the definition of unemployment involving the treatment of future starters not actively looking for work
- a change to coding of industry and occupation.
This note provides a summary of the main changes and their impact on LFS estimates. Further information can be found in Information Paper: Forthcoming Changes to Labour Force Statistics (cat. no. 6292.0), released on 16 December 2003.
Implementation of Revised Population Benchmarks
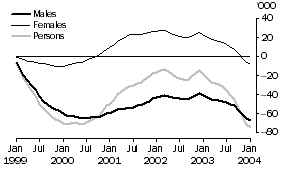
The civilian population aged 15 years and over has been revised downward, by no more than 0.5% in any month, for the period January 1999 to January 2004. The largest revision to the civilian population (-74,800) was in January 2004, as shown in the following graph.
Benchmark Revisions by sex

Male population benchmarks have been revised downward for the entire period (to a maximum of 0.9%), the largest revision being -67,100 in January 2004. In contrast, female population benchmarks have been predominantly revised upward (to a maximum of 0.3%), with the largest revision being +27,400 in March 2002.
Changes to civilian population benchmarks are not uniform across age groups. Benchmarks for age groups in the 20-29 year range have decreased significantly, with the largest decrease being 162,800 in January 2004. People in the 20-29 year age group have relatively high labour force participation rates. Benchmarks for older age groups have generally increased, but these increases only partly offset the falls in the younger age groups. The largest increase in the older age groups is for persons aged 65 years and over, an age group with a very low labour force participation rate.
As a result of the benchmark changes, over the period January 1999 to January 2004:
- employed persons have been revised down by an average of 66,300;
- unemployed persons have been revised down by an average of 8,100;
- the unemployment rate has been revised down by an average of 0.03 percentage points; and
- the participation rate has been revised down by an average of 0.32 percentage points.
Unemployed persons, the unemployment rate, and the participation rate are also affected by the definitional change involving future starters. See the relevant section below.
Because of age compositional effects, the downward revision to employment estimates is larger than the downward revision to the civilian population, with the largest revision being -100,200 for the January 2004 estimate. The graph below compares trend estimates for the period January 1999 to January 2004 before and after the revisions.
Employed Persons

Regional Benchmarks
Prior to the current benchmark revision, population benchmarks used in the LFS were classified by state/territory of usual residence, capital city/rest of state, age and sex. In addition to these population benchmarks, from February 2004 the LFS uses population benchmarks for labour force region by sex. There are currently 68 labour force regions across Australia. The introduction of regional benchmarks improves the quality of estimates for labour force regions without compromising the quality of estimates at national, state and territory levels.
LFS estimates for labour force regions (available each month in electronic products) have been revised back to January 1999.
Definitional Change for Future Starters
A minor change has been made to the definition of unemployed persons. The change relates to a small group of persons ('future starters') who had not actively looked for work because they were waiting to start a new job within four weeks from the end of the survey reference week, and could have started in the reference week if the job had been available then. These persons were previously classified as 'not in the labour force'. From February 2004 they are classified as unemployed, in line with International Labour Organisation guidelines.
Data to support this change has been available since the new LFS questionnaire was introduced in April 2001. However, the ABS announced then that, due to concerns that such a change could result in a break in some core labour force series, implementation of the change would be deferred until February 2004. LFS estimates have been revised back to April 2001 to reflect this change. Around 15,000 persons per month (on average) have been reclassified from 'not in the labour force' to unemployed. This revision creates a small trend break at April 2001 in unemployed persons and unemployment rate series.
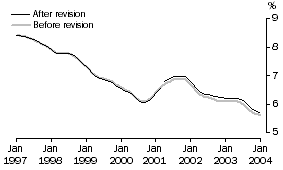
The effect of the definitional change on the unemployment rate is to revise it upwards by an average of 0.15 percentage points over the period from April 2001. When combined with the downward effects of the revised population benchmarks, the unemployment rate has been revised upwards over this period by an average of 0.11 percentage points. The graph below compares trend estimates of the unemployment rate for the period January 1999 to January 2004 before and after both sets of revisions.
Unemployment Rate

The effect of the definitional change on the participation rate is to revise it upwards by an average of 0.10 percentage points over the period from April 2001. When combined with the downward effects of the revised population benchmarks, the participation rate has been revised downwards over this period by an average of 0.27 percentage points.
Seasonal reanalysis
As a result of the revisions outlined above a reanalysis has been conducted on all seasonally adjusted LFS series. This reanalysis examines series for trend breaks, seasonal breaks, and outliers, and in this instance coincides with the normal annual reanalysis conducted at this time.
Further Information
Electronic products (cat. no. 6202.0.55.001) associated with this publication also contain revised data. In addition, more detailed products associated with the second release of LFS data (cat. no. 6291.0.55.001) have been re-issued today containing revised data up to, and including, January 2004. Second release products, including February 2004 estimates, will be released on 18 March 2004, in accordance with the standard timetable.
If users have any queries regarding the implementation of any of these changes to the LFS, they should contact Peter Bradbury on Canberra (02) 6252 6565, or via email at <peter.bradbury@abs.gov.au>.
 Print Page
 Print All