PRICE INDEXES AND CONTRACT PRICE INDEXATION
DECEMBER QUARTER KEY FIGURES
 | Sep Qtr 06 to Dec Qtr 06 | Dec Qtr 05 to Dec Qtr 06 |
| STAGE OF PRODUCTION | % change | % change |
|
| Final (Stage 3) commodities (excl. exports) | 0.2 | 3.5 |
| Domestic | 0.5 | 4.3 |
| Imports | -1.4 | -1.5 |
| Intermediate (Stage 2) commodities | 0.1 | 5.8 |
| Domestic | 0.8 | 6.3 |
| Imports | -4.2 | 2.8 |
| Preliminary (Stage 1) commodities | -0.5 | 6.0 |
| Domestic | 0.4 | 6.4 |
| Imports | -6.1 | 2.8 |
|
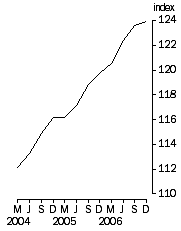
Final Stage, Base: 1998-99 = 100.0
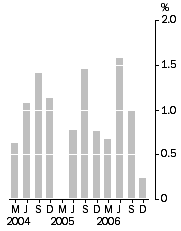
| Final Stage, Quarterly % change
|
DECEMBER QUARTER KEY POINTS
FINAL (STAGE 3) COMMODITIES
- The final (Stage 3) index increased by 0.2% in the December quarter 2006.
- The final (Stage 3) domestic index increased by 0.5%. Price increases in building construction and motor vehicle manufacturing were mostly offset by decreases in petroleum refining.
- The final (Stage 3) imports index decreased by -1.4% primarily due to decreases in the prices of imports of refined petroleum products.
INTERMEDIATE (STAGE 2) COMMODITIES
- The intermediate (Stage 2) index increased by 0.1% in the December quarter 2006.
- The intermediate (Stage 2) domestic index increased by 0.8% mainly due to increases in the price of outputs from metal ore mining industries
- The intermediate (Stage 2) imports index decreased by -4.2% due mainly to decreases in the price of products of oil and gas extraction, and petroleum refining.
PRELIMINARY (STAGE 1) COMMODITIES
- The preliminary (Stage 1) index decreased by -0.5% in the December quarter 2006.
- The preliminary (Stage 1) domestic index increased by 0.4% mainly due to price increases from property operators and developers.
- The preliminary (Stage 1) imports index decreased by -6.1% due to decreases in the price oil and gas extraction and petroleum refining products.
NOTES
FORTHCOMING ISSUES
| ISSUE (QUARTER) | Release Date |
| March 2007 | 23 April 2007 |
| June 2007 | 23 July 2007 |
CHANGES IN THIS ISSUE
There are no changes in this issue.
RELATED STATISTICS
For more information about statistics in this publication contact Lee Taylor on Canberra (02) 6252 6251, or email <lee.taylor@abs.gov.au>.
INQUIRIES
For further information about these and related statistics, contact the National Information and Referral Service on 1300 135 070 or Lee Taylor on Canberra (02) 6252 6251.
COMMENTARY
STAGE OF PRODUCTION OVERVIEW
The final (Stage 3) and intermediate (Stage 2) stage of production producer price indexes increased in the December quarter 2006 by 0.2% and 0.1% respectively. The preliminary (Stage 1) index decreased by -0.5%. Through the year to December 2006 the final (Stage 3) index rose by 3.5%, intermediate (Stage 2) by 5.8%, and preliminary (Stage 1) by 6.0%.
All three stages of production were heavily influenced this quarter by falls in prices of outputs from petroleum refining or oil and gas extraction industries, or both. While decreases for these components affected all stages of production, their impact was more apparent in the imports component of each stage.
The increase of 0.2% in the final (Stage 3) index reflects an increase of 0.5% in the domestically produced items partially offset by a -1.4% decrease for imported stage 3 items. The most significant contributors for the domestic final stage were building construction and motor vehicles and parts. These increases were almost completely offset by decreases in petroleum refining and other agriculture products (includes bananas). The imports component decreased -1.4% predominately due to falling petroleum refining prices.
In the intermediate (Stage 2) index the 0.1% increase resulted from an increase of 0.8% in the domestic component and a decrease of -4.2% in the imported component. The most significant contributors for the domestic intermediate stage were metal ore mining, other agriculture, property operators and developers. These increases were partially offset by decreases in petroleum refining and oil and gas extraction. The imports component decreased -4.2% mainly due to falling oil and gas extraction, and petroleum refining prices.
The preliminary (Stage 1) index decreased -0.5% due to a decrease of -6.1% in the imported component, with an offset in the domestic component of 0.4%. The most significant contributors for the imported preliminary stage were prices of oil and gas extraction and petroleum refining. For the domestic component, the most significant price increases were from property operators and developers, grain, sheep and beef farming, and metal ore mining.
COMPARISON OF SOP INDEXES: Base: 1998-99 = 100.0

MANUFACTURING INDUSTRIES PRODUCER PRICE INDEXES
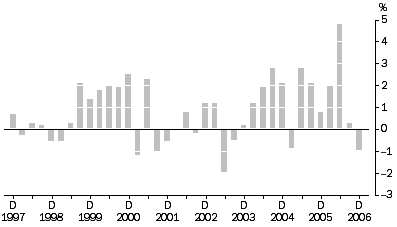
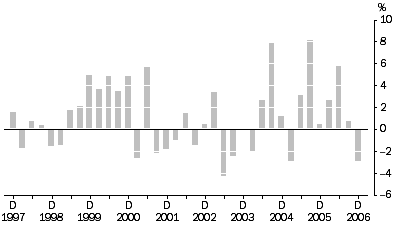
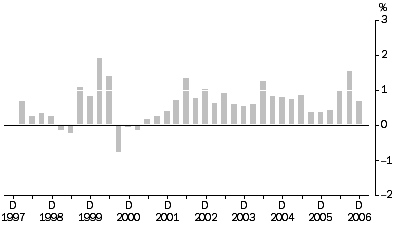
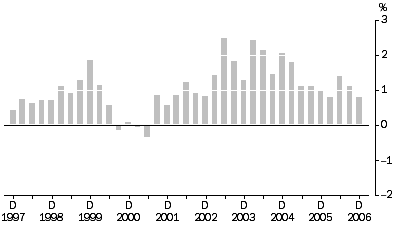
During the December quarter 2006, the prices paid by manufacturers for material inputs decreased by -3.0%, while the prices they received for their outputs decreased by -1.0%. The input price index increased by 6.3% through the year to December quarter 2006 and the output price index for the same period increased by 6.1%.
Decreases in the price of crude oil, cattle and calves, sheep and lambs and whole milk were the main contributors to the quarterly decrease for the materials used in manufacturing industries. Price increases for wheat and meslin and lead ores provided some offset to the price decreases.
Lower prices received for refined petroleum products were significant contributors to the decrease in the articles produced by manufacturing industries index for the December quarter 2006. These decreases were partially offset by increases in the prices of basic non-ferrous metals, meat products and bird and animal feeds.
Articles Produced By Manufacturing Industries, All groups: Quarterly % change
Materials Used In Manufacturing Industries, All groups: Quarterly % change
CONSTRUCTION INDUSTRIES PRODUCER PRICE INDEXES
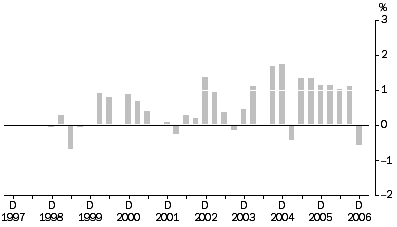
The price index for materials used in house building increased by 0.7% in the December quarter 2006, following a 1.5% increase in the September quarter 2006. The most significant increases were recorded for metal roofing, structural steel, copper pipework and aluminium windows. These increases were partially offset by falls in the price of structural timber and shower screens. The price of building materials used in housing in Sydney fell -0.3%, whereas the other capital cities recorded price increases, ranging from a 0.3% rise in Hobart to a 1.8% rise in Perth.
Through the year to December quarter 2006, the materials used in house building price index rose 3.7%.
Materials Used in House Building, All groups: Quarterly % change
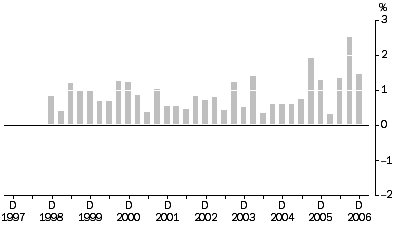
The price index for the output of the general construction industry increased by 0.8% in the December quarter 2006, and by 4.1% through the year to December quarter 2006. Increases were registered in the quarter for all component industries, with the index for non-residential construction the largest contributor, followed by house construction, residential building construction other than houses, and road and bridge construction.
Victoria contributed the most to the increase in the price index for the output of the general construction industry in the December quarter 2006, after a period of generally negative movements. This was mainly due to price increases for non-residential building construction. Western Australia and Queensland also recorded significant price increases. The contribution this quarter from New South Wales was negative due to decreases in the indexes for building construction.
Output Of The General Construction Industry, All groups: Quarterly % change
SERVICE INDUSTRIES PRODUCER PRICE INDEXES
The property & business services industries price index increased by 1.5% in the December quarter 2006 and by 5.7% through the year to December quarter 2006. The property services price index increased by 2.2% this quarter, with the most significant price increases recorded for commercial property operators and real estate agents. Through the year to December quarter 2006 the property services index rose by 8.4%.
Property and Business Services Industries, All groups: Quarterly % change
The business services index increased by 1.0% in the December quarter 2006 and by 4.1% through the year to December quarter 2006. The main contributors to the increase were computer consultancy and contract staff services.
The transport (freight) and storage industries index decreased by -0.6% in the December quarter 2006. The most significant contributors to the price fall were road freight, scheduled international air transport and rail freight transport. These price falls were partially offset by increases in the prices of services to water transport and water transport terminal services. Through the year to December quarter 2006 the transport (freight) and storage industries index rose by 2.7%.
Transport (Freight) And Storage Industries, All groups: Quarterly % change
 Print Page
 Print All