CREDIT MARKET
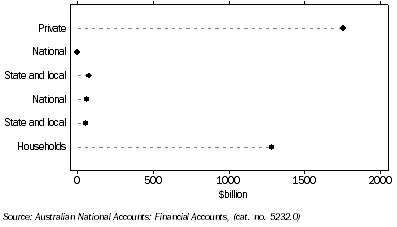
Credit market outstanding, (from Table 8.8) Non-financial domestic sector
- December Quarter 2008

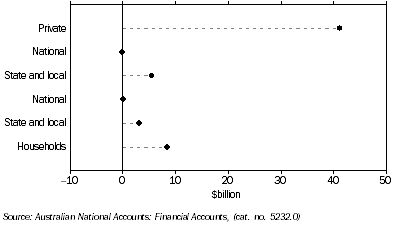
Demand for credit by, (from Table 8.8) Non-financial domestic sector
- December Quarter 2008

Credit market summary ($ billion) |
|
 |  |  |  | 2006-07 | 2007-08 | 2008-09 |
 |  | 2006-07 | 2007-08 | Jun | Sep | Dec | Mar | Jun | Sep | Dec |
Amounts outstanding at end of period |
|
Total debt and equity
outstandings of the
non-financial domestic
sectors | 3 266.6 | 3 459.1 | 3 266.6 | 3 411.5 | 3 457.1 | 3 373.8 | 3 459.1 | 3 348.5 | 3 231.0 |
| of: |  |  |  |  |  |  |  |  |  |
 | Private non-financial
corporations | 1 975.2 | 2 027.7 | 1 975.2 | 2 093.9 | 2 105.0 | 1 994.9 | 2 027.7 | 1 892.1 | 1 754.7 |
 | National public non-financial
corporations | 1.9 | 1.2 | 1.9 | 1.8 | 1.6 | 1.6 | 1.2 | 1.1 | 1.0 |
 | State and local public
non-financial corporations | 51.4 | 62.2 | 51.4 | 51.8 | 55.7 | 58.6 | 62.2 | 71.8 | 77.3 |
 | National general government | 56.8 | 60.0 | 56.8 | 58.9 | 57.5 | 59.0 | 60.0 | 60.1 | 62.8 |
 | State and local general
government | 34.1 | 49.9 | 34.1 | 37.8 | 36.7 | 37.1 | 49.9 | 50.8 | 54.0 |
 | Households | 1 147.3 | 1 258.2 | 1 147.3 | 1 167.2 | 1 200.6 | 1 222.7 | 1 258.2 | 1 272.6 | 1 281.2 |
Net transactions during period |
|
Total funds raised on
conventional credit markets
by non-financial
domestic sectors | 314.4 | 267.8 | 94.5 | 83.9 | 64.9 | 64.8 | 54.2 | 60.7 | 58.4 |
| of: |  |  |  |  |  |  |  |  |  |
 | Private non-financial
corporations | 166.9 | 141.9 | 37.9 | 59.2 | 29.9 | 38.7 | 14.2 | 42.1 | 41.2 |
 | Drawings of bills of exchange | 14.2 | 13.6 | 4.1 | 3.5 | 4.1 | 3.0 | 3.1 | 2.3 | 4.2 |
 | One name paper | -2.0 | 0.8 | -4.9 | -0.1 | 0.3 | 1.8 | -1.3 | 0.3 | -3.6 |
 | Bonds etc. | 17.7 | 5.8 | -2.2 | 3.5 | -7.2 | 2.1 | 7.3 | -3.2 | 10.5 |
 | Loans and placements | 72.9 | 74.5 | 21.0 | 40.5 | 20.1 | 21.1 | -7.3 | 25.3 | 10.2 |
 | Shares and other equity(a) | 64.1 | 47.3 | 19.9 | 11.8 | 12.5 | 10.7 | 12.3 | 17.4 | 19.8 |
 | National public
non-financial corporations | 16.3 | -0.7 | 0.0 | -0.1 | -0.2 | 0.0 | -0.4 | 0.0 | -0.1 |
 | Bills of exchange | 0.0 | 0.0 | 0.0 | 0.0 | 0.0 | 0.0 | 0.0 | 0.0 | 0.0 |
 | One name paper | 1.0 | 0.0 | 0.0 | 0.0 | 0.0 | 0.0 | 0.0 | 0.0 | 0.0 |
 | Bonds etc. | 0.1 | -0.1 | 0.0 | 0.0 | -0.2 | 0.0 | 0.0 | 0.0 | 0.0 |
 | Loans and placements | -0.3 | -0.6 | 0.0 | -0.1 | 0.0 | 0.0 | -0.5 | 0.0 | 0.0 |
 | Shares and other equity(a) | 15.5 | 0.0 | 0.0 | 0.0 | 0.0 | 0.0 | 0.0 | 0.0 | 0.0 |
 | State and local public
non-financial corporations | 4.3 | 10.8 | 1.0 | 0.5 | 3.8 | 2.9 | 3.6 | 9.6 | 5.5 |
 | Loans and placements | 4.3 | 10.8 | 1.0 | 0.5 | 3.8 | 2.9 | 3.6 | 9.6 | 5.5 |
 | National general government | -1.8 | 2.2 | 0.7 | 0.7 | -1.1 | 0.8 | 1.8 | -2.9 | 0.1 |
 | One name paper | 0.0 | 0.0 | 0.0 | 0.0 | 0.0 | 0.0 | 0.0 | 0.0 | 0.0 |
 | Bonds etc. | -1.7 | 1.9 | 0.8 | 0.7 | -1.3 | 0.8 | 1.8 | -3.0 | 0.0 |
 | Loans and placements | -0.2 | 0.1 | -0.1 | 0.0 | 0.3 | -0.1 | 0.0 | 0.0 | 0.0 |
 | State and local general
government | 0.3 | 7.6 | 1.7 | 3.7 | -1.1 | 0.4 | 4.5 | 0.9 | 3.1 |
 | Households | 128.4 | 105.9 | 53.3 | 19.9 | 33.5 | 22.0 | 30.6 | 11.1 | 8.5 |
 | Bills of exchange | 4.5 | 3.4 | 1.8 | 0.4 | 1.3 | 0.8 | 0.9 | -0.3 | 0.4 |
 | Loans and placements | 124.0 | 102.6 | 51.5 | 19.5 | 32.1 | 21.2 | 29.7 | 11.4 | 8.2 |
|
| (a) These estimates are considered to be of poor quality. They should be used with caution. |
| Source: Australian National Accounts: Financial Accounts, (cat. no. 5232.0) |
 Print Page
 Print Page