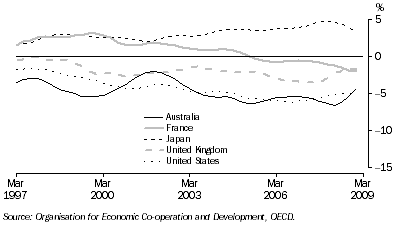
OVERSEAS COMPARISONS
Balance on current account, (from Table 10.2) Proportion of GDP

Balance on current account, Percentage of seasonally adjusted GDP(a) |
|
| Period | United States | Japan | Germany | France | Italy | United Kingdom | Canada | Australia |
Annual |
|
| 2005-06 | -5.9 | 3.7 | 5.1 | -0.6 | -1.8 | -2.7 | 1.9 | -5.7 |
| 2006-07 | -6.0 | 4.1 | 6.6 | -0.6 | -2.5 | -3.4 | 1.5 | -5.5 |
| 2007-08 | -5.2 | 4.7 | 7.9 | -1.1 | -2.5 | -2.6 | 1.0 | -6.3 |
Seasonally adjusted |
|
| 2006-2007 |  |  |  |  |  |  |  |  |
 | March | -5.9 | 4.1 | 7.1 | -0.6 | -2.5 | -3.5 | 1.2 | -5.5 |
 | June | -5.8 | 4.4 | 7.5 | -0.7 | -2.5 | -3.5 | 1.4 | -5.7 |
| 2007-2008 |  |  |  |  |  |  |  |  |
 | September | -5.5 | 4.7 | 7.9 | -0.8 | -2.4 | -3.5 | 1.3 | -6.0 |
 | December | -5.3 | 4.8 | 8.0 | -1.0 | -2.4 | -2.9 | 0.9 | -6.3 |
 | March | -5.1 | 4.8 | 8.0 | -1.2 | -2.6 | -2.2 | 1.0 | -6.5 |
 | June | -5.0 | 4.5 | 7.9 | -1.5 | -2.8 | -1.9 | 1.0 | -6.2 |
| 2008-2009 |  |  |  |  |  |  |  |  |
 | September | -5.0 | 4.0 | 7.5 | -1.9 | -3.0 | -1.6 | 1.2 | -5.4 |
 | December | -4.7 | 3.2 | 6.6 | -2.0 | -3.2 | -1.7 | 0.6 | -4.3 |
 | March | nya | nya | nya | nya | nya | nya | nya | nya |
|
| nya not yet available |
| (a) Statistics are calculated as the original balance on current account as a percentage of the seasonally adjusted current price gross domestic product, except for Japan and Germany, where real gross national product replaces gross domestic product. |
| Source: Organisation for Economic Co-operation and Development, OECD. |
Balance of payments(a)(b), Current balance |
|
| Period | United States | Japan | Germany | France | Italy | United Kingdom | Canada | China | India | Australia | New Zealand |
Annual (US $ billion) |
|
| 2005-06 | -834.5 | 64.7 | 183.7 | -43.0 | -22.0 | -87.4 | 50.2 | 123.8 | -45.6 | -10.4 | -4.4 |
| 2006-07 | -827.2 | 80.8 | 239.2 | -52.5 | -19.0 | -156.7 | 41.5 | 235.2 | -64.4 | -10.2 | -4.3 |
| 2007-08 | -840.6 | 80.9 | 296.0 | -87.3 | -16.0 | -191.8 | 45.0 | 245.9 | -86.2 | -19.1 | -3.5 |
Seasonally adjusted (US $ billion) |
|
| 2007-2008 |  |  |  |  |  |  |  |  |  |  |  |
 | January | -70.7 | 8.7 | 23.6 | -7.1 | -1.7 | -15.9 | 3.3 | 21.4 | -7.6 | -2.5 | -0.1 |
 | February | -73.0 | 6.1 | 23.9 | -6.0 | 0.3 | -15.7 | 5.6 | 17.7 | -7.4 | -2.9 | -0.1 |
 | March | -68.9 | 6.7 | 25.4 | -8.0 | -2.2 | -15.6 | 4.3 | 19.3 | -8.0 | -1.5 | -0.6 |
 | April | -73.5 | 6.0 | 27.5 | -8.9 | -1.9 | -15.3 | 6.9 | 20.6 | -7.9 | -0.7 | -0.4 |
 | May | -72.6 | 4.6 | 24.5 | -8.5 | -1.6 | -15.6 | 4.6 | 19.4 | -9.7 | -1.0 | -0.6 |
 | June | -71.8 | 0.8 | 26.5 | -9.6 | -1.8 | -16.6 | 4.3 | 17.9 | -9.1 | -0.6 | -0.3 |
| 2008-2009 |  |  |  |  |  |  |  |  |  |  |  |
 | July | -74.6 | 0.3 | 21.1 | -9.9 | -1.5 | -16.0 | 6.0 | 23.0 | -11.1 | -0.9 | -0.4 |
 | August | -71.6 | -3.0 | 22.6 | -9.4 | -2.8 | -14.6 | 4.6 | 26.7 | -13.3 | 0.8 | -0.3 |
 | September | -70.1 | -0.5 | 20.2 | -8.9 | -1.3 | -13.5 | 4.1 | 28.5 | -12.7 | 1.2 | -0.6 |
 | October | -69.6 | -2.5 | 19.6 | -9.5 | -0.9 | -12.4 | 3.1 | 25.6 | -8.1 | 1.9 | -0.3 |
 | November | -53.3 | -3.6 | 15.4 | -9.8 | -1.5 | -11.9 | 1.2 | 36.6 | -10.2 | 0.7 | -0.2 |
 | December | -51.5 | -1.6 | 16.1 | -5.9 | -0.4 | -10.3 | 0.6 | 35.7 | -8.5 | 0.1 | -0.2 |
 | January | -47.0 | -4.4 | 9.1 | -5.6 | -2.2 | -11.7 | -1.4 | 42.2 | nya | 0.7 | 0.1 |
 | February | nya | -0.5 | nya | nya | nya | -10.3 | nya | nya | nya | 1.3 | 0.1 |
 | March | nya | nya | nya | nya | nya | nya | nya | nya | nya | nya | nya |
|
| nya not yet available |
| (a) All series are exports (fob) less imports (cif) except for Canada and Australia where imports are also fob. Data are measured on a foreign trade basis. |
| (b) Excludes trade with the German Democratic Republic. |
| Source: Organisation for Economic Co-operation and Development, OECD. |
 Print Page
 Print Page