Quarterly changes to industries
Construction industries
Input to the house construction industry rose 0.2% this quarter, due to:
Annual and bi-annual rate rises for:
- Other materials (+1.0%).
- Ceramic products rose (+ 0.9%).
- Cement products rose (+1.5%).
The main contributing cities were:
- Melbourne (+0.5%), due to material cost rises for plaster and clay bricks.
- Sydney (+0.2%), due to material costs rises for plaster, clay bricks and ceramics.
- Hobart (+0.8%), due to material costs rises for ready mix concrete and clay bricks.
- Offset by a fall in Perth (-0.2%), prices fell slightly this quarter reflecting a weak housing market.
Input to the house construction industry, 6 Capitals: Quarterly
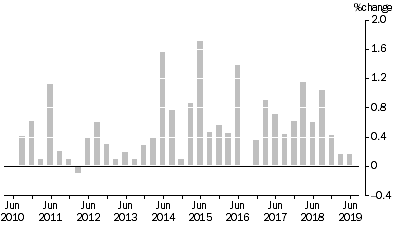
Over the last twelve months Input to house construction rose 1.8%, due to rises in prices for:
- Timber, board and joinery (+1.2%).
- Other materials (+2.5%).
- Electrical equipment (+6.1%).
- Other metal products (+1.2%).
Output of the construction industries:
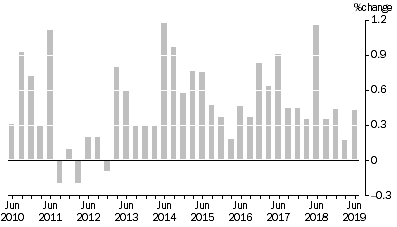
Subdivision 30 - Building construction rose 0.4% this quarter, driven by Non-residential construction and Other residential construction and rose 1.4% over the last twelve months.
Subdivision 30 Building construction, Quarterly
Class 3020 - Non-residential construction rose 0.8%, due to increases in site, material and labour costs:
- New South Wales (+1.4%), continued high volume of work driving competition for resources and rises in material costs.
- Victoria (+1.2%), due to rises in input costs as well as continued infrastructure investment strengthening the non-residential market.
- Tasmania (+1.7%), due to rising pricing pressures. The Hobart market remained strong allowing suppliers and builders to pass on costs.
- Over the last twelve months Non-residential building construction rose 2.3%.
Class 3019 - Other residential building construction rose 0.9%, due to increases in site, material and labour costs:
- New South Wales (+1.2%), due to increases in input costs such as concrete and labour.
- Victoria (+1.2%), due to material and labour price pressures.
- Tasmania (+1.8%), due to rises in both materials and labour as there was limited availability in the market.
- Over the last twelve months Other residential building construction rose 2.7%.
Partially offsetting the rise was a fall in Class 3011 - House construction fell 0.5%, due to a softening housing market as a result of tighter lending restrictions:
- Victoria (-0.8%), due to builders increasing promotional activity, having a downward impact on prices.
- Queensland (-0.9%) and New South Wales (-0.6%), due to builders increasing promotional activity and reduced pricing.
- Over the last twelve months House construction fell 0.7%.
Subdivision 31 - Heavy and civil engineering construction rose 0.5%, due to increases in cement, global oil and steel prices:
- Class 3109 - Other heavy and civil engineering construction (+0.6%).
- Class 3101 - Road and bridge construction (+0.5%).
- Over the last twelve months Other heavy and civil engineering construction rose 3.0% and Road and bridge construction rose 2.7%.
- Over the last twelve months Subdivision 31 - Heavy and Civil engineering construction rose 3.0%.
Mining industries
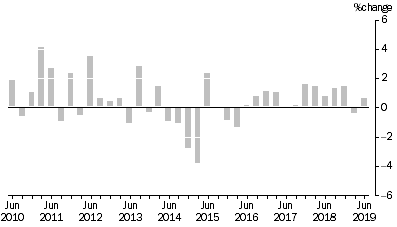
Input to the coal mining industry rose 0.6% this quarter, due to:
- Petroleum and coal product manufacturing, due to increased global oil prices resulting from production restrictions.
- Fabricated metal product manufacturing.
- Over the last twelve months Input to the coal mining industry rose 3.0%.
Input to the Coal Mining Industry, Quarterly
 Output of the mining industries
Prices received for Gas extraction, Domestic rose 3.3%, due to increased global oil prices resulting from production restrictions.
- Domestic, East coast market rose 3.5% and,
- Domestic, Western Australia rose 1.8%.
- Over the last twelve months Gas extraction, Domestic rose 4.9%.
Manufacturing industries
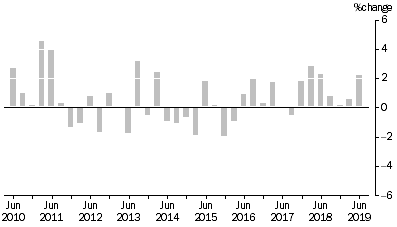
Input to the manufacturing industries rose 2.2% this quarter, due to:
- Metal ore mining manufacturing (+5.9%), due to increased iron ore prices affected by limited international supply and strong demand.
- Oil and gas extraction (+7.1%), due to global rises in crude oil prices driven by production restrictions.
- Agriculture to manufacturing (+3.1%), due to reduced supply of milk during the winter months.
- Over the last twelve months Input to the Manufacturing industries rose 3.9%.
Input to the manufacturing industries, Quarterly
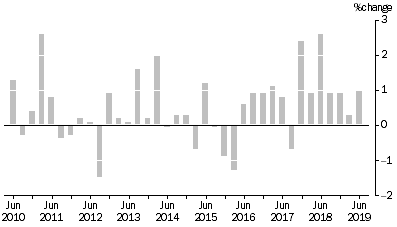
 Output of the manufacturing industries rose 1.0% this quarter, due to:
- Petroleum refining & petroleum fuel manufacturing (+9.3%), due to unleaded petrol driven by rising crude oil prices from production restrictions.
- Meat processing (+4.3%), due to higher beef prices as a result of increased export demand.
- Other basic non-ferrous metal manufacturing (+2.3%), due to increases in gold prices driven by economic uncertainty and a low Australian dollar.
- Over the last twelve months Output of the Manufacturing industries rose 3.0%.
Output of the manufacturing industries, Quarterly
 Services industries
Output of the Services industries
Accommodation and food services fell, driven by prices received for:
- Group 440 – Accommodation services (-5.9%), due to continued slowing demand after peak summer holiday season.
Transport, postal and warehousing industries rose, driven by prices received for:
- Group – 461 Road freight transport services (+0.6%), due to increased demand for these services.
- Class 5102 – Courier pick-up delivery services (+2.3%), due to increased business costs for interstate and international deliveries.
Rental, hiring and real estate services industries fell, driven by prices received for:
- Group 672 – Real estate services (-1.3%), due to the continued weakness in the residential property market and strong competitive pressures.
- Partially offsetting is Group 661 – Motor vehicle and transport equipment rental and hiring (+0.3%), due to increased demand in the April holiday period.
Professional, scientific and technical services industries rose, driven by prices received for:
- Group 693 – Legal & accounting services (+0.8%), due to increased demand witihin small to medium accounting firms.
- Group 692 – Architectural, engineering and technical services (+0.3%), due to increased wage costs.
Health care and social assistance industries rose, driven by prices received for:
- Group 851 – Medical services (+0.4%) and Group 871 – Child care services (+0.5%), due to increased operational costs.
 Quality Declaration
  Print Page
 Print All