AGRICULTURAL ENVIRONMENT
Australia's average elevation is the lowest of any continent, with a mean elevation just exceeding 200 metres. The dominant topographical feature of the continent is the Great Dividing Range, which spans the length of the eastern seaboard and has a profound influence on regional weather patterns and land use.
Australia's agricultural landscapes support a wide range of soils. Most are ancient, strongly weathered and infertile by world standards, with deficiencies in phosphorus and nitrogen. Those on floodplains are younger and more fertile. Very few are considered good quality soils for agriculture. To offset nutrient deficiencies, superphosphate and nitrogenous fertilisers are widely used, particularly on pasture and cereal crops. Fragile soil structure and a susceptibility to waterlogging are other common features of Australian soils, while large areas are naturally affected by salt or acidity. These soil characteristics restrict particular agricultural activities, sometimes ruling out agricultural activity altogether.
With the exception of Antarctica, Australia is the world's driest continent. More than a third of the continent is effectively desert; over two-thirds of the continent is classified as arid or semi-arid. The wet summer conditions of northern Australia are suited to beef cattle grazing in inland areas and the growing of sugar and tropical fruits in coastal areas. The drier summer conditions of southern Australia favour wheat and other dryland cereal farming, sheep grazing and dairy cattle (in the higher rainfall areas), as well as beef cattle. Within regions there is also a high degree of rainfall variability from year-to-year, which is most pronounced in the arid and semi-arid regions.
Rainfall variability is very high by global standards and often results in lengthy periods without rain. In the last five years, Australia has experienced two of the worst droughts on record - indeed, in some parts, one long drought lasting several years has been the experience. The years 2002-03 and 2006-07 have provided the most widespread hardship, with record high temperatures and dry conditions in the early months of 2005 also bringing severe drought to many regions. As a consequence, these adverse conditions have in some years resulted in lower commodity production levels and financial performance.
This variability, and seasonality of rainfall in Australia requires that water be stored. Under normal seasonal conditions, the ability of primary producers to store water ensures there are adequate supplies for those agricultural activities requiring a continuous supply. The development of large-scale irrigation schemes has opened up areas of inland Australia to agricultural activities which otherwise would not have been possible.
Evaporation is another important element of Australia's environment affecting agricultural production. Hot summers are accompanied by an abundance of sunlight. This combination of climatic variables leads to high rates of evaporation. Areas that have been cleared for crop and pasture production tend to coincide with areas that receive five to nine months of effective rainfall (where rainfall exceeds evaporation) each year. In areas of effective rainfall of more than nine months, generally only higher value crops or tropical crops and fruits are grown, while in areas with effective rainfall of less than five months, cropping is usually restricted to areas that are irrigated.
Since European settlement the vegetation of Australia has altered significantly. In particular, large areas of Australia's forest and woodland vegetation systems have been cleared, predominantly for agricultural activity. The areas that have been altered most are those which have been opened up to cultivation or intensive grazing. Other areas, particularly those semi-arid regions previously cleared of timber and scrub to allow extensive grazing of native grasses, now show signs of returning to their previous condition. In recent years various state and territory legislation has seen restrictions applied to the area of old growth and regrowth forest and woodland that can be cleared without a permit.
For more details see the Geography and climate chapter.
Land used
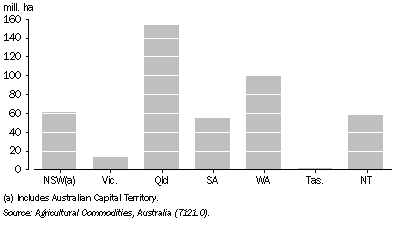
In spite of Australia's harsh environment, agriculture is the most extensive form of land use. At 30 June 2006, the estimated total area of establishments with agricultural activity was 442.8 million hectares (mill. ha), representing about 58% of the total land area - 5% of which had been cropped. Queensland had 154.1 mill. ha devoted to agricultural activity while Western Australia and New South Wales had 99.2 mill. ha and 61.2 mill. ha respectively (graph 16.1). Land area not used for agriculture consisted of unoccupied land (mainly desert in western and central Australia), Aboriginal land reserves (mainly located in the Northern Territory and Western Australia), forests, mining leases, national parks and urban areas.
16.1 Area of establishments with agricultural activity - 30 June 2006
Irrigation
The high variability in river flow and annual rainfall, which are features of the Australian environment, means that successful ongoing production of many crops and pastures is dependent on irrigation. In 2005-06, almost 30% (45,100) of all agricultural establishments reported irrigation activity. In total 10,800 gigalitres of irrigation water was applied in 2005-06, an average application rate of 4.2 megalitres per irrigated hectare.
Rice is only grown in areas that can guarantee an adequate supply of irrigation water. Grapes, vegetables, cotton, fruit (including nuts) and sugar cane are the other most intensively irrigated crops, with 90%, 90%, 82%, 71% and 44% respectively of their total growing areas being irrigated in 2005-06. However, the total area of land irrigated, about 2.6 mill. ha in 2005-06, represents less than 1% of the total land used for agriculture (table 16.2).
Most irrigated land is located within the confines of the Murray-Darling Basin, which covers parts of New South Wales, Victoria, Queensland and South Australia.
More information on the use of water by the agriculture sector is provided in the article
Irrigation on Australian farms.
16.2 PASTURES AND CROPS IRRIGATED - 2005-06 |
|  |
| | NSW(a) | Vic. | Qld | SA | WA | Tas. | NT | Aust. | |
Area Irrigated ('000ha) | |
| |
| Pastures (native or sown) | | | | | | | | | |
| For grazing | 250 | 404 | 51 | 53 | 13 | 41 | * - | 811 | |
| For seed production | 7 | 12 | 2 | 20 | *np | np | - | 44 | |
| For hay and silage | 72 | 81 | 34 | 17 | 2 | 5 | * - | 211 | |
| Cereal crops | | | | | | | | | |
| Cut for hay | 33 | 14 | 13 | 2 | ^np | ^np | *np | 62 | |
| For grain or seed(b) | 209 | 28 | 40 | 6 | 3 | 4 | - | 291 | |
| Not for grain or seed | 14 | 4 | 8 | 1 | * - | 1 | - | 28 | |
| Rice | 98 | 2 | (c) - | (c) - | (c) - | (c) - | (c) - | 100 | |
| Sugar cane | ^1 | (c) - | 217 | (c) - | 4 | (c) - | (c) - | 222 | |
| Cotton | 171 | (c) - | 105 | (c) - | (c) - | (c) - | (c) - | 277 | |
| Other broadacre crops(d) | 31 | 5 | 10 | 2 | 3 | 5 | - | 56 | |
| Fruit trees, nut trees, plantations or berry fruits | 30 | 33 | 40 | 19 | 9 | 3 | 4 | 140 | |
| Vegetables for human consumption | 18 | 26 | 40 | 14 | 9 | 14 | 1 | 121 | |
| Vegetables for seed | 1 | 2 | ^ - | 1 | ^ - | 1 | - | 5 | |
| Nurseries, cut flowers or cultivated turf | 5 | 4 | 5 | 1 | 2 | np | np | 17 | |
| Grapevines | 41 | 38 | 3 | 83 | 13 | 1 | - | 180 | |
| Total(e) | 986 | 657 | 572 | 219 | 62 | 80 | 6 | 2 583 | |
Volume applied (ML) | |
| |
| Pastures (native or sown) | | | | | | | | | |
| For grazing | 692 940 | 1 566 316 | 148 179 | 265 079 | 84 384 | 114 440 | ^49 | 2 871 388 | |
| For seed production | ^22 472 | 27 402 | ^5 941 | 94 077 | *np | np | - | 154 137 | |
| For hay and silage | 273 239 | 258 288 | 144 937 | 77 863 | ^10 073 | 10 685 | *2 246 | 777 330 | |
| Cereal crops | | | | | | | | | |
| Cut for hay | 77 924 | 27 022 | ^37 842 | 6 709 | ^np | ^np | *np | 149 953 | |
| For grain or seed(b) | 517 876 | 55 781 | 95 446 | ^8 385 | ^13 018 | 6 962 | - | 697 468 | |
| Not for grain or seed | 30 603 | 8 907 | 16 851 | ^1 637 | *867 | 1 653 | - | 60 518 | |
| Rice | 1 209 492 | 20 888 | (c) - | (c) - | (c) - | (c) - | (c) - | 1 230 379 | |
| Sugar cane | ^2 512 | (c) - | 1 040 929 | (c) - | ^60 361 | (c) - | (c) - | 1 103 802 | |
| Cotton | 1 120 188 | (c) - | 626 198 | (c) - | (c) - | (c) - | (c) - | 1 746 386 | |
| Other broadacre crops(d) | 98 609 | 11 228 | 26 137 | 6 816 | ^9 002 | 10 916 | - | 162 707 | |
| Fruit trees, nut trees, plantations or berry fruits | 135 466 | 191 810 | 133 975 | 146 063 | 50 133 | 5 146 | 12 673 | 675 265 | |
| Vegetables for human consumption | 74 584 | 88 978 | 107 562 | 83 075 | 53 748 | 40 317 | 2 304 | 450 567 | |
| Vegetables for seed | ^3 018 | 4 714 | ^400 | ^3 151 | ^1 112 | 2 417 | - | 14 812 | |
| Nurseries, cut flowers or cultivated turf | 27 935 | 14 155 | 26 407 | 5 859 | 14 973 | ^np | ^np | 91 645 | |
| Grapevines | 176 848 | 186 820 | ^15 936 | 225 875 | 17 409 | 1 194 | 1 573 | 625 655 | |
| Total(e) | 4 472 617 | 2 470 542 | 2 435 215 | 927 264 | 317 703 | 201 822 | 19 546 | 10 844 708 | |
| |
| ^ estimate has a relative standard error of 10% to less than 25% and should be used with caution |
| * estimate has a relative standard error of 25% to 50% and should be used with caution |
| - nil or rounded to zero (including null cells) |
| np not available for publication but included in totals where applicable, unless otherwise indicated |
| (a) Includes ACT. |
| (b) Excludes rice. |
| (c) Data not collected. |
| (d) Excludes sugar cane and cotton. |
| (e) Includes pastures or crops n.e.c. |
| Source: Water Use on Australian Farms (4618.0). |
 Print Page